Background coloring with bgcolor
The bgcolor
annotation function changes the color
of the script’s background. If the script is running in overlay=true mode,
then it will color the chart’s background.
The color used in bgcolor can be calculated in
an expression and an optional transp parameter (0–100, default 90) allows
control over the transparency level.
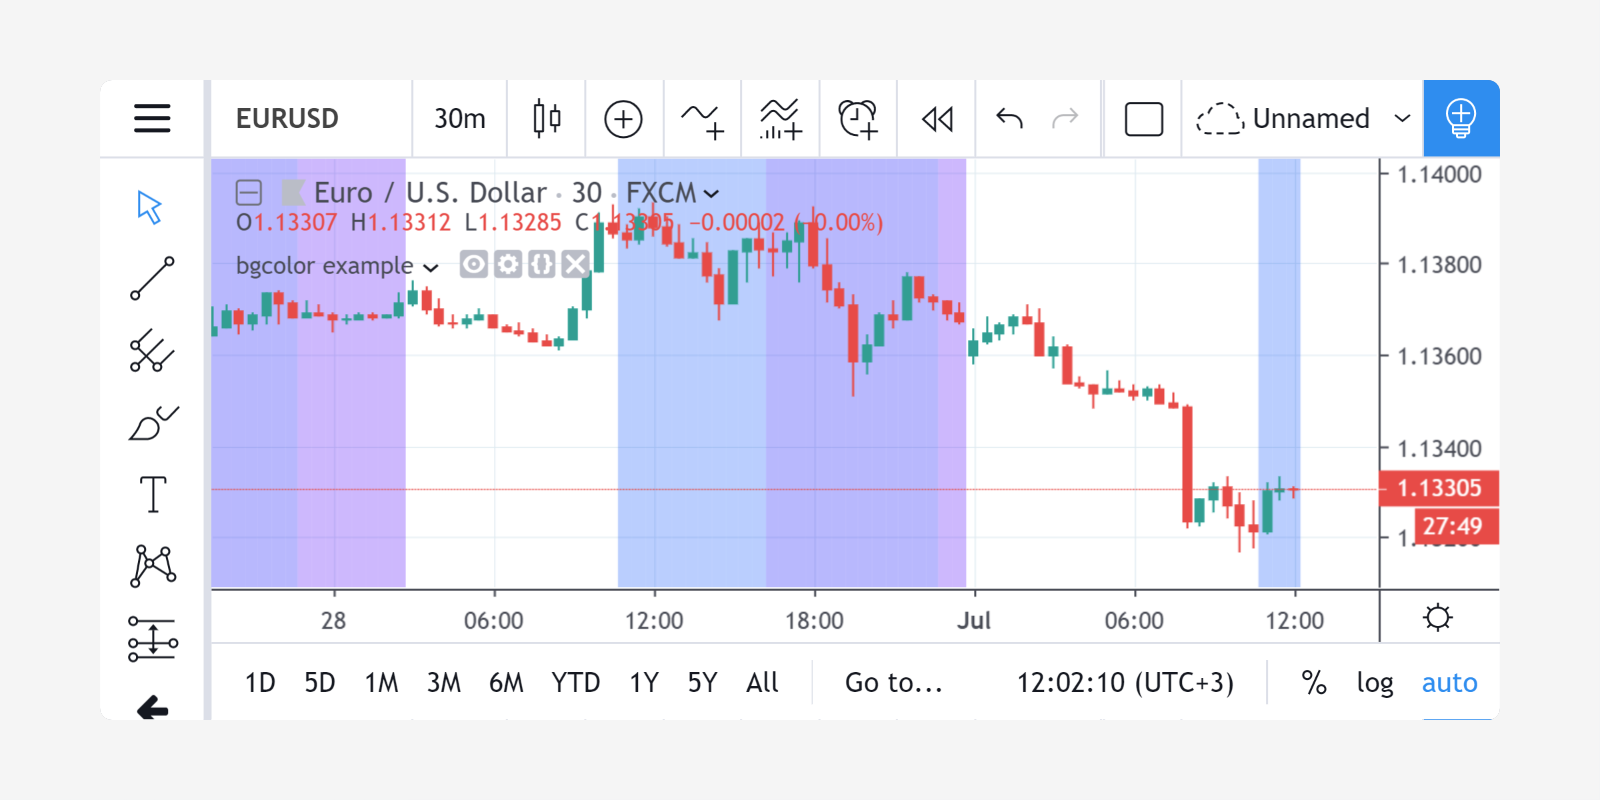
Here is a script that colors the background of trading sessions (try it on EURUSD, at 30 minutes resolution):
//@version=4
study("bgcolor example", overlay=true)
timeinrange(res, sess) => time(res, sess) != 0
premarket = #0050FF
regular = #0000FF
postmarket = #5000FF
color notrading = na
sessioncolor = timeinrange("30", "0400-0930") ? premarket :
  timeinrange("30", "0930-1600") ? regular :
  timeinrange("30", "1600-2000") ? postmarket : notrading
bgcolor(sessioncolor, transp=75)