Candle Price % ChangeIf you are using candle bottoms/tops for your stop-loss, this indicator allows you to see the price percentage difference between the current price and the high or low of a candle. This eliminates the need to manually measure the candle every time you need to determine your stop-loss %. It's particularly useful when scalping on small time frames like the 1m.
Komut dosyalarını "stop loss" için ara

ICT Directional FVG Indicator (Buffered SL)This is the first indicator I have ever made, and I am very new to Pine Script. I’ve tried my best to create this as a strategy, but I’m still learning, so please be kind and constructive with your feedback!
ICT Directional FVG Indicator (Buffered SL)
This indicator is designed for traders who follow ICT (Inner Circle Trader) concepts, focusing on Fair Value Gaps (FVGs), liquidity sweeps, and session-based trading. It automatically detects bullish and bearish FVGs, highlights them on the chart, and identifies liquidity sweep events. The indicator features three customizable Kill Zones (London, New York, and Asia sessions), each with independent toggles and color-coded backgrounds for clear visual separation.
Key features:
Fair Value Gap Detection: Highlights bullish and bearish FVGs in real time.
Liquidity Sweep Alerts: Marks potential liquidity sweep events for both highs and lows.
Session Kill Zones: Toggle each Kill Zone (London, New York, Asia) independently; background color changes only in enabled zones.
Trade Signal Visualization: Plots entry, stop loss, and take profit levels based on FVG and sweep logic, with a user-defined stop loss buffer.
Customizable Display: Easily enable or disable FVGs, sweeps, trade levels, and each Kill Zone to suit your strategy.
This tool is ideal for ICT-based traders who want a clear, automated view of FVGs, sweeps, and session activity, with full control over which sessions and signals are displayed.

(Mustang Algo) Stochastic RSI + Triple EMAStochastic RSI + Triple EMA (StochTEMA)
Overview
The Stochastic RSI + Triple EMA indicator combines the Stochastic RSI oscillator with a Triple Exponential Moving Average (TEMA) overlay to generate clear buy and sell signals on the price chart. By measuring RSI overbought/oversold conditions and confirming trend direction with TEMA, this tool helps traders identify high-probability entries and exits while filtering out noise in choppy markets.
Key Features
Stochastic RSI Calculation
Computes a standard RSI over a user-defined period (default 50).
Applies a Stochastic oscillator to the RSI values over a second user-defined period (default 50).
Smooths the %K line by taking an SMA over a third input (default 3), and %D is an SMA of %K over another input (default 3).
Defines oversold when both %K and %D are below 20, and overbought when both are above 80.
Triple EMA (TEMA)
Calculates three successive EMAs on the closing price with the same length (default 9).
Combines them using TEMA = 3×(EMA1 – EMA2) + EMA3, producing a fast-reacting trend line.
Bullish trend is identified when price > TEMA and TEMA is rising; bearish trend when price < TEMA and TEMA is falling; neutral/flat when TEMA change is minimal.
Signal Logic
Strong Buy: Previous bar’s Stoch RSI was oversold (both %K and %D < 20), %K crosses above %D, and TEMA is in a bullish trend.
Medium Buy: %K crosses above %D (without requiring oversold), TEMA is bullish, and previous %K < 50.
Weak Buy: Previous bar’s %K and %D were oversold, %K crosses above %D, TEMA is flat or bullish (not bearish).
Strong Sell: Previous bar’s Stoch RSI was overbought (both %K and %D > 80), %K crosses below %D, and TEMA is bearish.
Medium Sell: %K crosses below %D (without requiring overbought), TEMA is bearish, and previous %K > 50.
Weak Sell: Previous bar’s %K and %D were overbought, %K crosses below %D, TEMA is flat or bearish (not bullish).
Visual Elements on Chart
TEMA Line: Plotted in cyan (#00BCD4) with a medium-thick line for clear trend visualization.
Buy/Sell Markers:
BUY STRONG: Lime label below the candle
BUY MEDIUM: Green triangle below the candle
BUY WEAK: Semi-transparent green circle below the candle
SELL STRONG: Red label above the candle
SELL MEDIUM: Orange triangle above the candle
SELL WEAK: Semi-transparent orange circle above the candle
Candle & Background Coloring: When a strong buy or sell signal occurs, the candle body is tinted (semi-transparent lime/red) and the chart background briefly flashes light green (buy) or light red (sell).
Dynamic Support/Resistance:
On a strong buy signal, a green dot is plotted under that bar’s low as a temporary support marker.
On a strong sell signal, a red dot is plotted above that bar’s high as a temporary resistance marker.
Alerts
Strong Buy Alert: Triggered when Stoch RSI is oversold, %K crosses above %D, and TEMA is bullish.
Strong Sell Alert: Triggered when Stoch RSI is overbought, %K crosses below %D, and TEMA is bearish.
General Buy Alert: Triggered on any bullish crossover (%K > %D) when TEMA is not bearish.
General Sell Alert: Triggered on any bearish crossover (%K < %D) when TEMA is not bullish.
Inputs
Stochastic RSI Settings (group “Stochastic RSI”):
K (smoothK): Period length for smoothing the %K line (default 3, minimum 1)
D (smoothD): Period length for smoothing the %D line (default 3, minimum 1)
RSI Length (lengthRSI): Number of bars used for the RSI calculation (default 50, minimum 1)
Stochastic Length (lengthStoch): Number of bars for the Stochastic oscillator applied to RSI (default 50, minimum 1)
RSI Source (src): Price source for the RSI (default = close)
TEMA Settings (group “Triple EMA”):
TEMA Length (lengthTEMA): Number of bars used for each of the three EMAs (default 9, minimum 1)
How to Use
Add the Script
Copy and paste the indicator code into TradingView’s Pine Editor (version 6).
Save the script and add it to your chart as “Stochastic RSI + Triple EMA (StochTEMA).”
Adjust Inputs
Choose shorter lengths for lower timeframes (e.g., intraday scalping) and longer lengths for higher timeframes (e.g., swing trading).
Fine-tune the Stochastic RSI parameters (K, D, RSI Length, Stochastic Length) to suit the volatility of the instrument.
Modify TEMA Length if you prefer a faster or slower moving average response.
Interpret Signals
Primary Entries/Exits: Focus on “BUY STRONG” and “SELL STRONG” signals, as they require both oversold/overbought conditions and a confirming TEMA trend.
Confirmation Signals: Use “BUY MEDIUM”/“BUY WEAK” to confirm or add to an existing position when the market is trending. Similarly, “SELL MEDIUM”/“SELL WEAK” can be used to scale out or confirm bearish momentum.
Support/Resistance Dots: These help identify recent swing lows (green dots) and swing highs (red dots) that were tagged by strong signals—useful to place stop-loss or profit-target orders.
Set Alerts
Open the Alerts menu (bell icon) in TradingView, choose this script, and select the desired alert condition (e.g., “BUY Signal Strong”).
Configure notifications (popup, email, webhook) according to your trading workflow.
Notes & Best Practices
Filtering False Signals: By combining Stoch RSI crossovers with TEMA trend confirmation, most false breakouts during choppy price action are filtered out.
Timeframe Selection: This indicator works on all timeframes, but shorter timeframes may generate frequent signals—consider higher-timeframe confirmation when trading lower timeframes.
Risk Management: Always use proper position sizing and stop-loss placement. An “oversold” or “overbought” reading can remain extended for some time in strong trends.
Backtesting/Optimization: Before live trading, backtest different parameter combinations on historical data to find the optimal balance between sensitivity and reliability for your chosen instrument.
No Guarantee of Profits: As with any technical indicator, past performance does not guarantee future results. Use in conjunction with other forms of analysis (volume, price patterns, fundamentals).
Author: Your Name or Username
Version: 1.0 (Pine Script v6)
Published: June 2025
Feel free to customize input values and visual preferences. If you find bugs or have suggestions for improvements, open an issue or leave a comment below. Trade responsibly!

Levels Of Interest------------------------------------------------------------------------------------
LEVELS OF INTEREST (LOI)
TRADING INDICATOR GUIDE
------------------------------------------------------------------------------------
Table of Contents:
1. Indicator Overview & Core Functionality
2. VWAP Foundation & Historical Context
3. Multi-Timeframe VWAP Analysis
4. Moving Average Integration System
5. Trend Direction Signal Detection
6. Visual Design & Display Features
7. Custom Level Integration
8. Repaint Protection Technology
9. Practical Trading Applications
10. Setup & Configuration Recommendations
------------------------------------------------------------------------------------
1. INDICATOR OVERVIEW & CORE FUNCTIONALITY
------------------------------------------------------------------------------------
The LOI indicator combines multiple VWAP calculations with moving averages across different timeframes. It's designed to show where institutional money is flowing and help identify key support and resistance levels that actually matter in today's markets.
Primary Functions:
- Multi-timeframe VWAP analysis (Daily, Weekly, Monthly, Yearly)
- Advanced moving average integration (EMA, SMA, HMA)
- Real-time trend direction detection
- Institutional flow analysis
- Dynamic support/resistance identification
Target Users: Day traders, swing traders, position traders, and institutional analysts seeking comprehensive market structure analysis.
------------------------------------------------------------------------------------
2. VWAP FOUNDATION & HISTORICAL CONTEXT
------------------------------------------------------------------------------------
Historical Development: VWAP started in the 1980s when big institutional traders needed a way to measure if they were getting good fills on their massive orders. Unlike regular price averages, VWAP weighs each price by the volume traded at that level. This makes it incredibly useful because it shows you where most of the real money changed hands.
Mathematical Foundation: The basic math is simple: you take each price, multiply it by the volume at that price, add them all up, then divide by total volume. What you get is the true "average" price that reflects actual trading activity, not just random price movements.
Formula: VWAP = Σ(Price × Volume) / Σ(Volume)
Where typical price = (High + Low + Close) / 3
Institutional Behavior Patterns:
- When price trades above VWAP, institutions often look to sell
- When it's below, they're usually buying
- Creates natural support and resistance that you can actually trade against
- Serves as benchmark for execution quality assessment
------------------------------------------------------------------------------------
3. MULTI-TIMEFRAME VWAP ANALYSIS
------------------------------------------------------------------------------------
Core Innovation: Here's where LOI gets interesting. Instead of just showing daily VWAP like most indicators, it displays four different timeframes simultaneously:
**Daily VWAP Implementation**:
- Resets every morning at market open
- Provides clearest picture of intraday institutional sentiment
- Primary tool for day trading strategies
- Most responsive to immediate market conditions
**Weekly VWAP System**:
- Resets each Monday (or first trading day)
- Smooths out daily noise and volatility
- Perfect for swing trades lasting several days to weeks
- Captures weekly institutional positioning
**Monthly VWAP Analysis**:
- Resets at beginning of each calendar month
- Captures bigger institutional rebalancing at month-end
- Fund managers often operate on monthly mandates
- Significant weight in intermediate-term analysis
**Yearly VWAP Perspective**:
- Resets annually for full-year institutional view
- Shows long-term institutional positioning
- Where pension funds and sovereign wealth funds operate
- Critical for major trend identification
Confluence Zone Theory: The magic happens when multiple VWAP levels cluster together. These confluence zones often become major turning points because different types of institutional money all see value at the same price.
------------------------------------------------------------------------------------
4. MOVING AVERAGE INTEGRATION SYSTEM
------------------------------------------------------------------------------------
Multi-Type Implementation: The indicator includes three types of moving averages, each with its own personality and application:
**Exponential Moving Averages (EMAs)**:
- React quickly to recent price changes
- Displayed as solid lines for easy identification
- Optimal performance in trending market conditions
- Higher sensitivity to current price action
**Simple Moving Averages (SMAs)**:
- Treat all historical data points equally
- Appear as dashed lines in visual display
- Slower response but more reliable in choppy conditions
- Traditional approach favored by institutional traders
**Hull Moving Averages (HMAs)**:
- Newest addition to the system (dotted line display)
- Created by Alan Hull in 2005
- Solves classic moving average dilemma: speed vs. accuracy
- Manages to be both responsive and smooth simultaneously
Technical Innovation: Alan Hull's solution addresses the fundamental problem where moving averages are either too slow (missing moves) or too fast (generating false signals). HMAs achieve optimal balance through weighted calculation methodology.
Period Configuration:
- 5-period: Short-term momentum assessment
- 50-period: Intermediate trend identification
- 200-period: Long-term directional confirmation
------------------------------------------------------------------------------------
5. TREND DIRECTION SIGNAL DETECTION
------------------------------------------------------------------------------------
Real-Time Momentum Analysis: One of LOI's best features is its real-time trend detection system. Next to each moving average, visual symbols provide immediate trend assessment:
Symbol System:
- ▲ Rising average (bullish momentum confirmation)
- ▼ Falling average (bearish momentum indication)
- ► Flat average (consolidation or indecision period)
Update Frequency: These signals update in real-time with each new price tick and function across all configured timeframes. Traders can quickly scan daily and weekly trends to assess alignment or conflicting signals.
Multi-Timeframe Trend Analysis:
- Simultaneous daily and weekly trend comparison
- Immediate identification of trend alignment
- Early warning system for potential reversals
- Momentum confirmation for entry decisions
------------------------------------------------------------------------------------
6. VISUAL DESIGN & DISPLAY FEATURES
------------------------------------------------------------------------------------
Color Psychology Framework: The color scheme isn't random but based on psychological associations and trading conventions:
- **Blue Tones**: Institutional neutrality (VWAP levels)
- **Green Spectrum**: Growth and stability (weekly timeframes)
- **Purple Range**: Longer-term sophistication (monthly analysis)
- **Orange Hues**: Importance and attention (yearly perspective)
- **Red Tones**: User-defined significance (custom levels)
Adaptive Display Technology: The indicator automatically adjusts decimal places based on the instrument you're trading. High-priced stocks show 2 decimals, while penny stocks might show 8. This keeps the display incredibly clean regardless of what you're analyzing - no cluttered charts or overwhelming information overload.
Smart Labeling System: Advanced positioning algorithm automatically spaces all elements to prevent overlap, even during extreme zoom levels or multiple timeframe analysis. Every level stays clearly readable without any visual chaos disrupting your analysis.
------------------------------------------------------------------------------------
7. CUSTOM LEVEL INTEGRATION
------------------------------------------------------------------------------------
User-Defined Level System: Beyond the calculated VWAP and moving average levels, traders can add custom horizontal lines at any price point for personalized analysis.
Strategic Applications:
- **Psychological Levels**: Round numbers, previous significant highs/lows
- **Technical Levels**: Fibonacci retracements, pivot points
- **Fundamental Targets**: Analyst price targets, earnings estimates
- **Risk Management**: Stop-loss and take-profit zones
Integration Features:
- Seamless incorporation with smart labeling system
- Custom color selection for visual organization
- Extension capabilities across all chart timeframes
- Maintains display clarity with existing indicators
------------------------------------------------------------------------------------
8. REPAINT PROTECTION TECHNOLOGY
------------------------------------------------------------------------------------
Critical Trading Feature: This addresses one of the most significant issues in live trading applications. Most multi-timeframe indicators "repaint," meaning they display different signals when viewing historical data versus real-time analysis.
Protection Benefits:
- Ensures every displayed signal could have been traded when it appeared
- Eliminates discrepancies between historical and live analysis
- Provides realistic performance expectations
- Maintains signal integrity across chart refreshes
Configuration Options:
- **Protection Enabled**: Default setting for live trading
- **Protection Disabled**: Available for backtesting analysis
- User-selectable toggle based on analysis requirements
- Applies to all multi-timeframe calculations
Implementation Note: With protection enabled, signals may appear one bar later than without protection, but this ensures all signals represent actionable opportunities that could have been executed in real-time market conditions.
------------------------------------------------------------------------------------
9. PRACTICAL TRADING APPLICATIONS
------------------------------------------------------------------------------------
**Day Trading Strategy**:
Focus on daily VWAP with 5-period moving averages. Look for bounces off VWAP or breaks through it with volume. Short-term momentum signals provide entry and exit timing.
**Swing Trading Approach**:
Weekly VWAP becomes your primary anchor point, with 50-period averages showing intermediate trends. Position sizing based on weekly VWAP distance.
**Position Trading Method**:
Monthly and yearly VWAP provide broad market context, while 200-period averages confirm long-term directional bias. Suitable for multi-week to multi-month holdings.
**Multi-Timeframe Confluence Strategy**:
The highest-probability setups occur when daily, weekly, and monthly VWAPs cluster together, especially when multiple moving averages confirm the same direction. These represent institutional consensus zones.
Risk Management Integration:
- VWAP levels serve as dynamic stop-loss references
- Multiple timeframe confirmation reduces false signals
- Institutional flow analysis improves position sizing decisions
- Trend direction signals optimize entry and exit timing
------------------------------------------------------------------------------------
10. SETUP & CONFIGURATION RECOMMENDATIONS
------------------------------------------------------------------------------------
Initial Configuration: Start with default settings and adjust based on individual trading style and market focus. Short-term traders should emphasize daily and weekly timeframes, while longer-term investors benefit from monthly and yearly level analysis.
Transparency Optimization: The transparency settings allow clear price action visibility while maintaining level reference points. Most traders find 70-80% transparency optimal - it provides a clean, unobstructed view of price movement while maintaining all critical reference levels needed for analysis.
Integration Strategy: Remember that no indicator functions effectively in isolation. LOI provides excellent context for institutional flow and trend direction analysis, but should be combined with complementary analysis tools for optimal results.
Performance Considerations:
- Multiple timeframe calculations may impact chart loading speed
- Adjust displayed timeframes based on trading frequency
- Customize color schemes for different market sessions
- Regular review and adjustment of custom levels
------------------------------------------------------------------------------------
FINAL ANALYSIS
------------------------------------------------------------------------------------
Competitive Advantage: What makes LOI different is its focus on where real money actually trades. By combining volume-weighted calculations with multiple timeframes and trend detection, it cuts through market noise to show you what institutions are really doing.
Key Success Factor: Understanding that different timeframes serve different purposes is essential. Use them together to build a complete picture of market structure, then execute trades accordingly.
The integration of institutional flow analysis with technical trend detection creates a comprehensive trading tool that addresses both short-term tactical decisions and longer-term strategic positioning.
------------------------------------------------------------------------------------
END OF DOCUMENTATION
------------------------------------------------------------------------------------

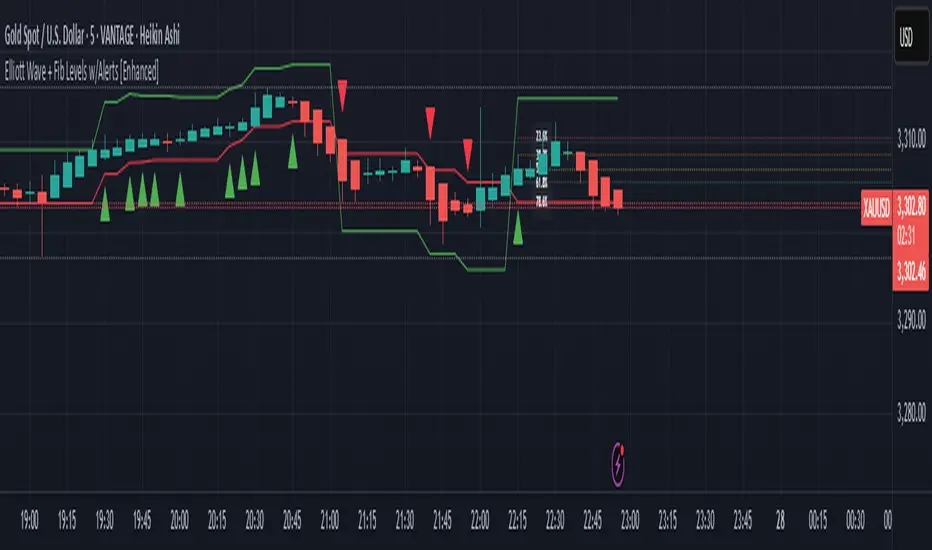
Elliott Wave + Fib Levels w/Alerts [Enhanced]Elliott Wave + Fibonacci Levels with Alerts
This powerful TradingView indicator combines Elliott Wave detection with customizable Fibonacci retracement levels to help identify key price zones and potential trade opportunities. It automatically detects bullish and bearish waves based on recent highs and lows, with an optional EMA filter to improve trend accuracy.
Key features include:
Dynamic detection of Elliott Waves based on configurable wave length.
Visualization of Fibonacci retracement levels on detected waves, with customizable percentage levels and optional labels for clarity.
ATR-based automatic calculation of stop loss and take profit levels with adjustable multipliers.
Real-time alerts triggered on new wave formations, indicating bullish or bearish setups with precise entry price details.
Clean plotting of entry signals, stop loss, and take profit zones directly on the chart.
User-friendly input controls to tailor the indicator to your trading style, including options to toggle EMA filtering, Fibonacci level display, and alert activation.
Ideal for traders looking to combine classic wave analysis with Fibonacci support/resistance levels and actionable trade alerts, this indicator streamlines technical analysis and trade management in one easy-to-use tool.
Bollinger Bands [LePasha]Bollinger Bands : Advanced Volatility Analysis Made Simple
Discover a refined take on Bollinger Bands that offers clearer market insights and deeper volatility understanding — perfect for traders seeking precision and confidence.
What Is the Bollinger Bands Indicator?
The Bollinger Bands indicator is a powerful, overlay chart tool designed to help traders visualize price volatility and identify potential market extremes more effectively.
Unlike classic Bollinger Bands which use just two standard deviation bands, this enhanced version employs multiple deviation levels around a simple moving average (SMA) to give a richer picture of market dynamics.
Key Features
Multiple Deviation Bands: Instead of only ±2 standard deviations, it uses three extended levels: 2.5, 3.0, and 3.5 standard deviations to highlight subtle and extreme price movements.
Color-coded Volatility Zones: Each band range is filled with translucent red or teal shades to help traders visually grasp the intensity of price moves.
Customizable Length and Toggle: Adjust the length of the bands and enable or disable the indicator easily through inputs.
Why Three Deviation Levels?
Traditional Bollinger Bands (±2 standard deviations) cover approximately 95% of price action, but markets often present significant moves beyond this range that are important to identify for better risk management and trading decisions.
The three deviation levels serve distinct purposes:
Deviation Level Approximate Purpose Market Insight Provided
±2.5 SD Captures strong but fairly common moves Entry/exit trigger zones for trending moves
±3.0 SD Highlights more extreme, less frequent moves Indicates breakout strength or overextension
±3.5 SD Marks rare and extreme price deviations Signals potential reversal or exhaustion
This graduated scale allows traders to differentiate between normal volatility, strong momentum, and possible exhaustion—making it easier to tailor trading decisions according to market context.
How to Use Bollinger Bands
Identify Volatility Zones:
Observe how price interacts with the colored bands:
Price touching or crossing the ±2.5 SD band may indicate a strong move is underway.
Price breaching the ±3.0 or ±3.5 SD bands signals rare, extreme market conditions, which could be either a breakout or a setup for reversal.
Combine With Trend Analysis:
Use in conjunction with trend indicators like moving averages or volume to confirm the direction or strength of moves indicated by the bands.
Adjust Your Stops and Targets:
The layered bands help you set more intelligent stop losses and take profit zones by understanding how far price can reasonably stray.
Visual Clarity for Market Phases:
The shaded fills between bands give intuitive visual cues of volatility expansion and contraction phases.
Why Traders Choose Bollinger Bands
Greater Precision: More nuanced volatility detection than traditional Bollinger Bands.
Visual Elegance: Soft translucent fills and clear band lines reduce clutter while delivering maximum insight.
User-Friendly: Easy to toggle and adjust with minimal setup.
Versatile: Effective across assets, timeframes, and trading styles.
Final Thoughts
The Bollinger Bands indicator is more than just a volatility tool — it's your visual guide to understanding how extreme price moves develop in real-time. Whether you’re entering new trades, managing risk, or hunting reversals, this indicator equips you with superior clarity and confidence.
Add Bollinger Bands to your TradingView toolkit and see volatility like never before.

MestreDoFOMO Future Projection BoxMestreDoFOMO Future Projection Box - Description & How to Use
Description
The "MestreDoFOMO Future Projection Box" is a TradingView indicator tailored for crypto traders (e.g., BTC/USDT on 1H, 4H, or 1D timeframes). It visualizes current price ranges, projects future levels, and confirms trends using semi-transparent boxes. With labeled price levels and built-in alerts, it’s a simple yet powerful tool for identifying support, resistance, and potential price targets.
How It Works
Blue Box (Current Channel): Shows the recent price range over the last 10 bars (adjustable). The top is the highest high plus an ATR buffer, and the bottom is the lowest low minus the buffer. Labels display exact levels (e.g., "Top: 114000", "Bottom: 102600").
Green Box (Future Projection): Projects the price range 10 bars ahead (adjustable) based on the trend slope of the moving average. Labels show "Proj Top" and "Proj Bottom" for future targets.
Orange Box (Moving Average): Traces a 50-period EMA (adjustable) to confirm the trend. An upward slope signals a bullish trend; a downward slope signals a bearish trend. A label shows the current MA value (e.g., "MA: 105000").
Alerts: Triggers when the price nears the projected top or bottom, helping you catch breakouts or retracements.
How to Use
Add the Indicator: Apply "MestreDoFOMO Future Projection Box" to your chart in TradingView.
Interpret the Trend: Check the orange box’s slope—upward for bullish, downward for bearish.
Identify Key Levels: Use the blue box’s top as resistance and bottom as support. On a 4H chart, if the top is 114,000, expect resistance; if the bottom is 102,600, expect support.
Plan Targets: Use the green box for future targets—top for profit-taking (e.g., 114,000), bottom for stop-loss or buying (e.g., 102,600).
Set Alerts: Enable alerts for "Near Upper Projection" or "Near Lower Projection" to get notified when the price hits key levels.
Trade Examples:
Bullish: If the price breaks above the blue box top (e.g., 114,000), buy with a target at the green box top. Set a stop-loss below the green box bottom.
Bearish: If the price rejects at the blue box top and drops below the orange MA, short with a target at the blue box bottom.
Customize: Adjust the lookback period, projection bars, ATR multiplier, and MA length in the settings to fit your trading style.
Tips
Use on 1H for short-term trades, 4H for swing trades, or 1D for long-term trends.
Combine with volume or RSI to confirm signals.
Validate levels with market structure (e.g., candlestick patterns).

Canuck Trading IndicatorOverview
The Canuck Trading Indicator is a versatile, overlay-based technical analysis tool designed to assist traders in identifying potential trading opportunities across various timeframes and market conditions. By combining multiple technical indicators—such as RSI, Bollinger Bands, EMAs, VWAP, MACD, Stochastic RSI, ADX, HMA, and candlestick patterns—the indicator provides clear visual signals for bullish and bearish entries, breakouts, long-term trends, and options strategies like cash-secured puts, straddles/strangles, iron condors, and short squeezes. It also incorporates 20-day and 200-day SMAs to detect Golden/Death Crosses and price positioning relative to these moving averages. A dynamic table displays key metrics, and customizable alerts help traders stay informed of market conditions.
Key Features
Multi-Timeframe Adaptability: Automatically adjusts parameters (e.g., ATR multiplier, ADX period, HMA length) based on the chart's timeframe (minute, hourly, daily, weekly, monthly) for optimal performance.
Comprehensive Signal Generation: Identifies short-term entries, breakouts, long-term bullish trends, and options strategies using a combination of momentum, trend, volatility, and candlestick patterns.
Candlestick Pattern Detection: Recognizes bullish/bearish engulfing, hammer, shooting star, doji, and strong candles for precise entry/exit signals.
Moving Average Analysis: Plots 20-day and 200-day SMAs, detects Golden/Death Crosses, and evaluates price position relative to these averages.
Dynamic Table: Displays real-time metrics, including zone status (bullish, bearish, neutral), RSI, MACD, Stochastic RSI, short/long-term trends, candlestick patterns, ADX, ROC, VWAP slope, and MA positioning.
Customizable Alerts: Over 20 alert conditions for entries, exits, overbought/oversold warnings, and MA crosses, with actionable messages including ticker, price, and suggested strategies.
Visual Clarity: Uses distinct shapes, colors, and sizes to plot signals (e.g., green triangles for bullish entries, red triangles for bearish entries) and overlays key levels like EMA, VWAP, Bollinger Bands, support/resistance, and HMA.
Options Strategy Signals: Suggests opportunities for selling cash-secured puts, straddles/strangles, iron condors, and capitalizing on short squeezes.
How to Use
Add to Chart: Apply the indicator to any TradingView chart by selecting "Canuck Trading Indicator" from the Pine Script library.
Interpret Signals:
Bullish Signals: Green triangles (short-term entry), lime diamonds (breakout), blue circles (long-term entry).
Bearish Signals: Red triangles (short-term entry), maroon diamonds (breakout).
Options Strategies: Purple squares (cash-secured puts), yellow circles (straddles/strangles), orange crosses (iron condors), white arrows (short squeezes).
Exits: X-cross shapes in corresponding colors indicate exit signals.
Monitor: Gray circles suggest holding cash or monitoring for setups.
Review Table: Check the top-right table for real-time metrics, including zone status, RSI, MACD, trends, and MA positioning.
Set Alerts: Configure alerts for specific signals (e.g., "Short-Term Bullish Entry" or "Golden Cross") to receive notifications via TradingView.
Adjust Inputs: Customize input parameters (e.g., RSI period, EMA length, ATR period) to suit your trading style or market conditions.
Input Parameters
The indicator offers a wide range of customizable inputs to fine-tune its behavior:
RSI Period (default: 14): Length for RSI calculation.
RSI Bullish Low/High (default: 35/70): RSI thresholds for bullish signals.
RSI Bearish High (default: 65): RSI threshold for bearish signals.
EMA Period (default: 15): Main EMA length (15 for day trading, 50 for swing).
Short/Long EMA Length (default: 3/20): For momentum oscillator.
T3 Smoothing Length (default: 5): Smooths momentum signals.
Long-Term EMA/RSI Length (default: 20/15): For long-term trend analysis.
Support/Resistance Lookback (default: 5): Periods for support/resistance levels.
MACD Fast/Slow/Signal (default: 12/26/9): MACD parameters.
Bollinger Bands Period/StdDev (default: 15/2): BB settings.
Stochastic RSI Period/Smoothing (default: 14/3/3): Stochastic RSI settings.
Uptrend/Short-Term/Long-Term Lookback (default: 2/2/5): Candles for trend detection.
ATR Period (default: 14): For volatility and price targets.
VWAP Sensitivity (default: 0.1%): Threshold for VWAP-based signals.
Volume Oscillator Period (default: 14): For volume surge detection.
Pattern Detection Threshold (default: 0.3%): Sensitivity for candlestick patterns.
ROC Period (default: 3): Rate of change for momentum.
VWAP Slope Period (default: 5): For VWAP trend analysis.
TradingView Publishing Compliance
Originality: The Canuck Trading Indicator is an original script, combining multiple technical indicators and custom logic to provide unique trading signals. It does not replicate existing public scripts.
No Guaranteed Profits: This indicator is a tool for technical analysis and does not guarantee profits. Trading involves risks, and users should conduct their own research and risk management.
Clear Instructions: The description and usage guide are detailed and accessible, ensuring users understand how to apply the indicator effectively.
No External Dependencies: The script uses only built-in Pine Script functions (e.g., ta.rsi, ta.ema, ta.vwap) and requires no external libraries or data sources.
Performance: The script is optimized for performance, using efficient calculations and adaptive parameters to minimize lag on various timeframes.
Visual Clarity: Signals are plotted with distinct shapes and colors, and the table provides a concise summary of market conditions, enhancing usability.
Limitations and Risks
Market Conditions: The indicator may generate false signals in choppy or low-liquidity markets. Always confirm signals with additional analysis.
Timeframe Sensitivity: Performance varies by timeframe; test settings on your preferred chart (e.g., 5-minute for day trading, daily for swing trading).
Risk Management: Use stop-losses and position sizing to manage risk, as suggested in alert messages (e.g., "Stop -20%").
Options Trading: Options strategies (e.g., straddles, iron condors) carry unique risks; consult a financial advisor before trading.
Feedback and Support
For questions, suggestions, or bug reports, please leave a comment on the TradingView script page or contact the author via TradingView. Your feedback helps improve the indicator for the community.
Disclaimer
The Canuck Trading Indicator is provided for educational and informational purposes only. It is not financial advice. Trading involves significant risks, and past performance is not indicative of future results. Always perform your own due diligence and consult a qualified financial advisor before making trading decisions.

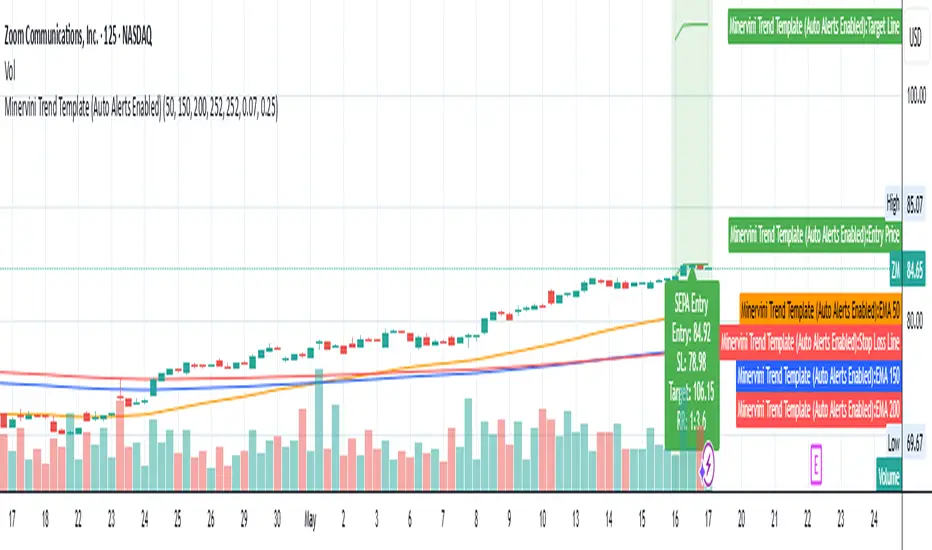
Minervini Trend Template (EMA)📄 Description:
This script is inspired by Mark Minervini’s SEPA (Specific Entry Point Analysis) strategy and adapts his famous Trend Template using Exponential Moving Averages (EMAs). It helps traders visually identify technically strong stocks that are in ideal buy conditions based on Minervini's rules.
📈 Strategy Logic:
This script scans for momentum breakouts by filtering stocks with the following characteristics:
✅ Buy Criteria (All Conditions Must Be Met):
Price above 50-day EMA
Price above 150-day EMA
Price above 200-day EMA
50-day EMA above 150-day EMA
150-day EMA above 200-day EMA
200-day EMA trending upward (greater than it was 20 days ago)
Price within 25% of its 52-week high
Price at least 30% above its 52-week low
If all 8 conditions are satisfied, the script triggers a SEPA Setup Signal. This is visually indicated by:
✅ A green background on the chart
✅ A label saying “SEPA Setup” under the bar
🛒 When to Buy:
Wait for the stock to break out above a recent base or consolidation pattern (like a cup-with-handle or flat base) on strong volume.
The ideal entry is within 5% of the breakout point.
Confirm that the SEPA conditions are met on the breakout day.
📉 When to Sell:
Place a stop-loss 5–8% below your entry price.
Exit if the breakout fails and price falls back below the pivot or the 50-day EMA.
Take partial profits after a 20–25% gain, and move your stop-loss up to breakeven or trail it using moving averages like the 21 or 50 EMA.
Exit fully if price closes below the 50-day or 150-day EMA on volume.
🧠 Why EMAs?
EMAs react faster to recent price action than SMAs, helping you catch earlier signals in fast-moving markets. This makes it especially useful for growth and momentum traders following Minervini’s high-performance approach.
📊 How to Use:
Apply the script to any stock chart (daily timeframe recommended).
Look for a green background + SEPA Setup label.
Combine with price/volume analysis, base patterns, and market context to time your entries.
🚨 Optional Alerts:
You can set an alert on the condition minerviniPass == true to notify you when a SEPA-compliant setup appears.
📚 This tool is meant for educational and research purposes. Always validate with your own due diligence and consult your risk plan before making any trades.
ADR, ATR & VOL OverlayThis is a combined version of 2 of my other indicators:
ADR / ATR Overlay
VOL / AVG Overlay
This indicator will display the following as an overlay on your chart:
ADR
% of ADR
ADR % of Price
ATR
% of ATR
ATR % of Price
Custom Session Volume
Average For Selected Session
Volume Percentage Comparison
Description:
ADR : Average Day Range
% of ADR : Percentage that the current price move has covered its average.
ADR % of Price : The percentage move implied by the average range.
ATR : Average True Range
% of ATR : Percentage that the current price move has covered its average.
ATR % of Price : The percentage move implied by the average true range.
Custom Session Volume : User chosen time frame to monitor volume
Average For Selected Session : Average for the custom session volume
Volume Percentage Comparison : Current session compared to the average (calculated at session close)
Options:
ADR/ATR:
Time Frame
Length
Smoothing
Volume:
Set Custom Time Frame For Calculations
Set Custom Time Frame For Average Comparison
Set Custom Time Zone
Table:
Enable / Disable Each Value
Change Text Color
Change Background Color
Change Table location
Add/Remove extra row for placement
ADR / ATR Example:
The ADR and ATR can be used to provide information about average price moves to help set targets, stop losses, entries and exits based on the potential average moves.
Example: If the "% of ADR" is reading 100%, then 100% of the asset's average price range has been covered, suggesting that an additional move beyond the range has a lower probability.
Example: "ADR % of Price" provides potential price movement in percentage which can be used to asses R/R for asset.
Example: ADR (D) reading is 100% at market close but ATR (D) is at 70% at close. This suggests that there is a potential (coverage) move of 30% in Pre/Post market as suggested by averages.
Custom Volume Session Example:
Set indicator to 30 period average. Set custom time frame to 9:30am to 10:30am Eastern/New York.
When the time frame for the calculation is closed, the indicator will provide a comparison of the current days volume compared to the average of 30 previous days for that same time frame and display it as a percentage in the table.
In this example you could compare how the first hour of the trading day compares to the previous 30 day's average, aiding in evaluating the potential volume for the remainder of the day.
Notes:
Times must be entered in 24 hour format. (1pm = 13:00 etc.)
Volume indicator is for Intra-day time frames, not > Day.
How I use these values:
I use these calculations to determine if a ticker symbol has the necessary range to achieve target gains, to determine if the price oscillation is within "normal" ranges to determine if the trading day will be choppy, and to determine placement of stops and targets within average ranges in combination with support, resistance and retracement levels.

Horizontal ATR LinesDisclaimer:
This script was generated using OpenAI’s ChatGPT. I take no responsibility for the correctness, performance, or financial impact of this indicator. Use it at your own risk and discretion.
This indicator draws horizontal ATR-based levels from the last closed candle on a user-selected timeframe. It is designed for traders who want to visualize realistic volatility zones for setting dynamic support/resistance, take-profit, or stop-loss levels.
What it does:
Calculates the Average True Range (ATR) using a customizable period and timeframe.
Plots four horizontal lines:
+1 ATR and –1 ATR from the last closed candle’s close
+X ATR and –X ATR, where X is a second custom multiplier
Each level includes a compact label showing:
The price of the level
The percentage distance from the close price
Use cases:
Identify realistic intraday or swing price movement boundaries
Build volatility-aware take-profit and stop-loss zones
Visually track market compression or expansion in context
Customization:
ATR period and timeframe
Two independent ATR multipliers
Custom color settings for each group of levels

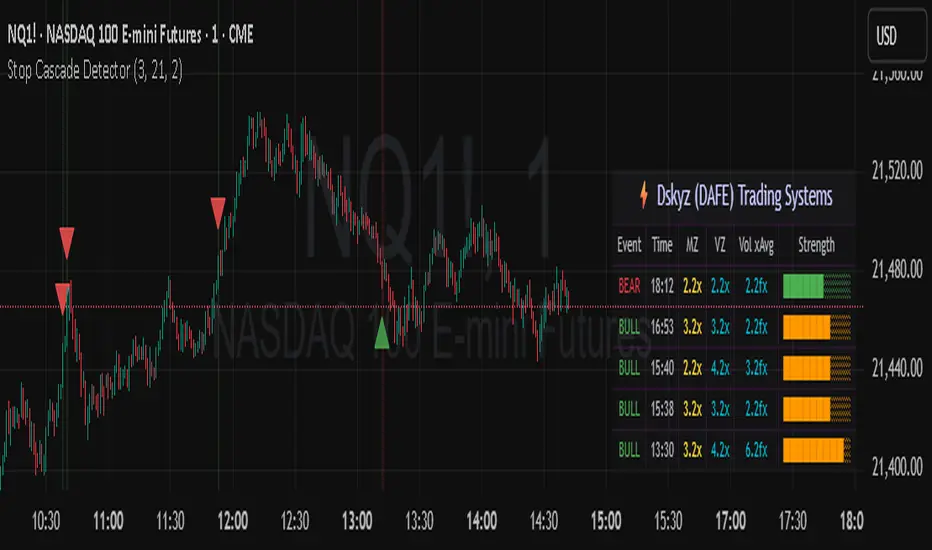
Stop Cascade Detector Stop Cascade Detector (DAFE)
Unlock the Hidden Triggers of Market Momentum!
The Stop Cascade Detector (Bull & Bear, Info Bubble) is a next-generation tool designed for traders who want to see what the crowd can’t: the precise moments when clusters of stop orders are being triggered, unleashing explosive moves in either direction. The reason for this is traders taking there position too early. We on the other hand will take our positions once the less informed traders have been liquidated.
What Makes This Indicator Unique?
Not Just Another Volatility Tool:
This script doesn’t just measure volatility or volume. It detects the chain reactions that occur when price and volume spikes combine to trigger stop-loss clusters—events that often precede the most powerful surges and reversals in any market.
Directional Intelligence:
Unlike generic “spike” detectors, this tool distinguishes between bullish stop cascades (green, above the bar) and bearish stop cascades (red, below the bar), giving you instant clarity on which side of the market is being liquidated.
Visual Precision:
Each event is marked with a color-coded info bubble and a triangle, clearly separated from the price bars for maximum readability. No more guessing where the action is—see it, trade it, and stay ahead.
Universal Application:
Works on any asset, any timeframe, and in any market—futures, stocks, crypto, forex. If there are stops, this indicator will find the cascade.
What makes it work?
Momentum + Volume Spike:
The detector identifies bars where both price momentum and volume are simultaneously extreme (using Z-scores). This combination is a classic signature of stop runs and forced liquidations.
Bull & Bear Detection:
Bull Stop Cascade : Price plunges downward with a volume spike—likely longs getting stopped out.
Bear Stop Cascade: Price surges upward with a volume spike—likely shorts getting stopped out.
Info Bubbles:
Each event is labeled with the exact Z-scores for momentum and volume, so you can gauge the intensity of the cascade at a glance.
What will it do for you?
Front-Run the Crowd:
Most traders react after the move. This tool helps you spot the cause of the move—giving you a tactical edge to fade exhaustion, ride momentum, or avoid getting trapped.
Perfect for Scalpers, Day Traders, and Swing Traders:
Whether you’re looking for high-probability reversals or want to ride the wave, knowing when stops are being triggered is a game-changer.
No More Blind Spots:
Stop cascades are the hidden fuel behind many of the market’s biggest moves. Now you can see them in real time.
How to Use
Red Bubble Above Bar: Bear stop cascade detected—watch for possible trend acceleration or reversal.
Green Bubble Below Bar: Bull stop cascade detected—watch for possible trend acceleration or reversal.
Combine with Your Strategy : Use as a confirmation tool, a reversal signal, or a filter for high-volatility environments. Level up your trading. See the market’s hidden triggers.
Stop Cascade Detector: Because the real edge is knowing what sets the market on fire.
For educational purposes only. Not financial advice. Always use proper risk management.
Use with discipline. Trade your edge.
— Dskyz, for DAFE Trading Systems
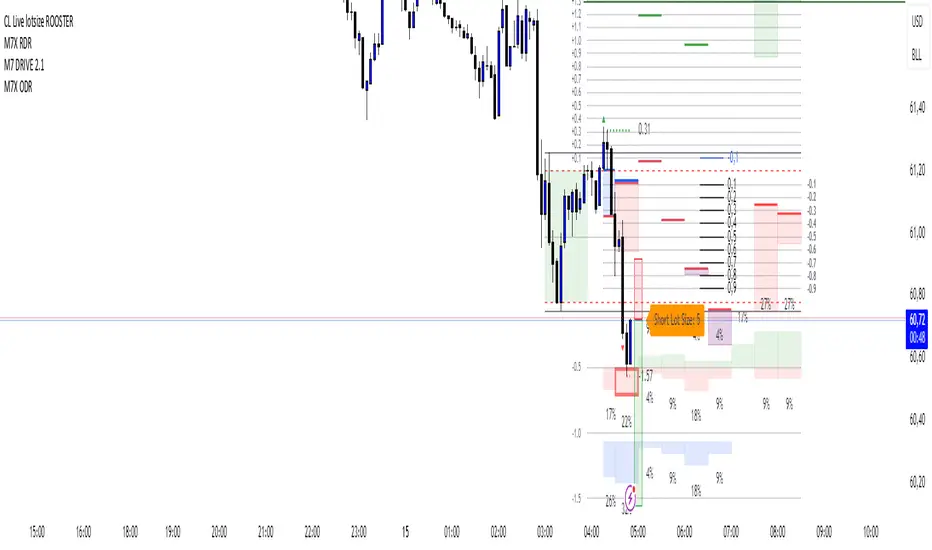
CL Live lotsize ROOSTER📄 Description:
This is a utility script designed for manual futures traders who enter with market orders and want to size their positions precisely based on $ risk.
⚙️ Features:
✅ Calculates live contract size based on:
A fixed dollar risk amount (e.g. $100)
A manually set static stop-loss price
The live market price as your entry
✅ Uses a configurable risk-reward ratio (e.g. 1:3)
✅ Plots entry, stop, and target levels on the chart
✅ Displays calculated contract size as a floating label
🎯 Why this tool?
Built to support fast execution workflows , this tool helps traders who:
Enter trades at candle close or open
Want to pre-calculate their market order size before the signal
Prefer a visual, consistent, real-time R:R validation system
Avoid fumbling with the long/short position tool at the last second
🔧 Settings:
Static Stop-Loss Price: Enter the price level where you'd place your SL
Account Risk ($): How much you’re willing to risk per trade
Risk-Reward Ratio: Set your target multiplier (e.g. 3 for 3R)
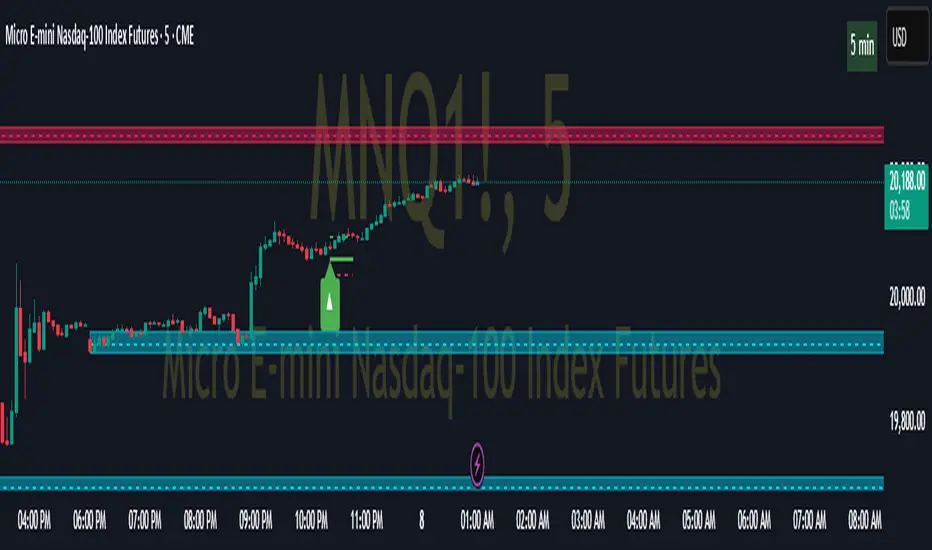
Pivot ATR Zones [v6]🟩 Pivot ATR Zones
Overview:
The Pivot ATR Zones indicator plots dynamic support and resistance zones based on pivot highs and lows, combined with ATR (Average True Range) volatility levels. It helps traders visually identify potential long and short trade areas, along with realistic target and stop loss zones based on market conditions.
Features:
Automatically detects pivot highs and lows
Draws ATR-based entry zones on the chart
Plots dynamic take-profit and stop-loss levels using ATR multipliers
Color-coded long (green) and short (red) zones
Entry arrow markers for clearer trade visualization
Real-time alerts when new zones form
Best For:
Scalpers, intraday traders, and swing traders who want a visual, volatility-aware way to mark potential trade areas based on key pivot structures.
How to Use:
Look for newly formed green zones for long opportunities and red zones for short setups.
Use the dashed lines as dynamic take-profit and stop levels, tuned to the current ATR value.
Combine with other confirmation tools or indicators for optimal results.
Key Recent Highs and LowsKey Recent Highs & Lows — Session‐Aware Market Structure
TL;DR
This tool plots the most important intraday price extremes for every U.S.‑equity trading segment—Early Premarket • Western Premarket • Regular Hours • Post‑Market Hours • Yesterday’s Range—and labels them so you can trade break‑outs, retests and mean‑reversion with instant context.
📐 Theory & Why These Levels Matter
Liquidity Pools
Visible session extremes attract resting orders (stop‑losses, take‑profits, opening prints). Price often accelerates into them and reacts at them.
Market Memory
The previous day’s high/low is a widely‑watched pivot for gap fills, overnight inventory corrections and multi‑day breakouts.
Mean‑Reversion Windows
Statistically, pre‑ and post‑market ranges are thin; an aggressive spike outside those bands often retraces when full liquidity returns.
Break‑Out Confirmation
A true breakout isn’t just a tick above RTH‑high—it usually closes or at least consolidates above the prior extreme. Seeing all bands lets you gauge whether a push is “real” or just probing thinner sessions.
Put simply, these levels help you decide:
Break‑out ➜ trade in the direction of expansion past a session extreme with follow‑through.
Fade/Mean‑Revert ➜ fade a spike that tags an extreme without commitment (e.g., hits Western‑Premkt‑High then stalls before RTH).
🔍 What the Script Draws
Session (UTC‑4 EST) Default Color / Style Typical Use‑Case
Early Premarket 4 – 7 AM Thick semi‑transparent orange line detect overnight retail spikes / fade plays
Western Premarket 7 – 9 : 30 AM Dashed orange‑red breakout watch as U.S. brokers open
Regular Session (RTH) 9 : 30 – 16 : 00 Bold teal dotted line core intraday structure; classic highs/lows
Post‑Market 16 – 23 : 59 Soft indigo band after‑hours news moves, earnings fades
Previous‑Day RTH Solid teal gap‑fill targets, trend continuation filters
(All colors, thicknesses and transparencies are editable in the settings.)
✨ Features
Real‑Time Updates
Levels refresh tick‑by‑tick inside their own session—no repainting later.
One‑Click Visibility Toggles
Show or hide any session extreme independently.
Clean Auto‑Labels
Optional right‑edge tags (“RTH High”, “Premkt Low”, etc.) keep your chart readable even when lines overlap.
Automatic Daily Reset
At midnight Eastern, buffers clear and yesterday’s extremes roll into the “Prev‑Day” pair.
Zero‑Noise Design
Transparencies and line styles are tuned so you can overlay on any symbol / timeframe without drowning candles.
📈 How to Trade with It
Intraday Breakout Strategy
Mark confluence (e.g., price pushes through Western Premkt High and Yesterday’s High).
Wait for a pullback that holds above the reclaimed band.
Enter with stop under that session line; target next band or measured‑move.
Fade / Mean‑Reversion
Pre‑market headline sends price 5 % above Early Premkt High.
Volume dries up before RTH open.
Short into exhaustion; cover near Western Premkt High or VWAP.
Gap‑Fill & Trend Days
Cash open gaps above Prev‑Day High.
If first 15‑min candle closes back inside yesterday’s range, bias shifts to downside fade.
If it holds above, treat gap as breakout and track RTH High extensions.
Pair it with volume‑profile, VWAP, or momentum oscillators for even higher‑confidence setups.
⚙️ Settings Cheat‑Sheet
Setting Effect
Show Regular / Premarket / Post‑market High/Low Master visibility per session
Show Previous Day High/Low Toggle yesterday’s anchor range
Show Session Labels Turn the right‑edge tags on/off
Style Panel Change each line’s color, width, transparency, dash/dot
🛠️ Best Practices
Works on any intraday timeframe (1‑min to 1‑hour).
Crypto or 24 h markets: adjust session times to match your exchange.
Combine with alerts (e.g., “price crossing RTH High”) for hands‑free monitoring.
Put KRHL on your chart and you’ll never wonder which high matters most again—because they’re all right there, clearly labeled and color‑coded. Trade breakouts or fades with confidence, armed with the exact market structure everyone else is watching.

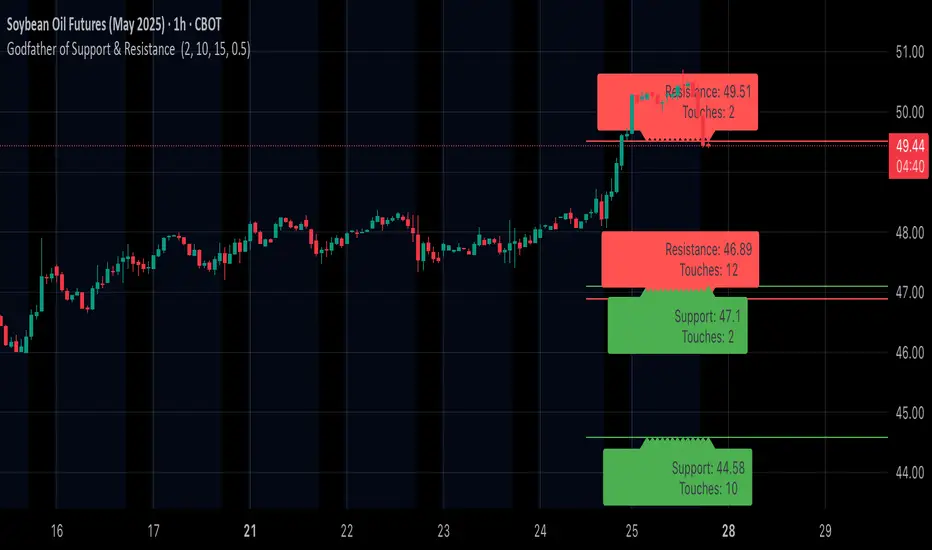
Godfather of Support & Resistance Godfather of Support & Resistance
Overview
The Godfather of Support & Resistance script is a powerful tool designed to help traders identify critical support and resistance levels on their charts. These price levels are vital for understanding market behavior, as they often act as turning points where prices reverse, consolidate, or break through. By automating the detection of these levels, this script simplifies your trading decisions and enhances your technical analysis.
How It Works
Pivot Points for Level Detection:
The script uses pivot points to identify potential support (lows) and resistance (highs) levels:
A pivot high is a local peak (a high surrounded by lower highs).
A pivot low is a local trough (a low surrounded by higher lows).
You can adjust the Pivot Length (pivotLen) input to control the sensitivity of detection. Smaller values detect more levels, while larger values focus on major levels.
Dynamic Grouping with Tolerance:
The script dynamically groups nearby price levels using a tolerance percentage. This tolerance is based on the level's price, making it adaptive to all types of assets (low- and high-priced).
For example, if the tolerance is set to 1% and a level is at $100, levels within $1 are grouped together.
Touch Count for Significance:
The script tracks how many times the price interacts with each level (touch count). Only levels that meet or exceed the Minimum Touches (minTouches) input are displayed on the chart. This ensures only meaningful levels are highlighted.
Clear Visual Representation:
Resistance Levels (Red Lines): Represent areas where the price tends to reverse downward.
Support Levels (Green Lines): Represent areas where the price tends to reverse upward.
Labels are added to each level (optional) to display the price and the number of touches for better decision-making.
Inputs You Can Customize
Minimum Touches to Show Level:
Set the minimum number of price interactions required for a level to be displayed.
Maximum Lines to Keep:
Limit the number of support and resistance lines displayed to keep your chart clean and focused.
Pivot Length:
Customize the sensitivity of pivot point detection. Smaller values detect more levels, while larger values focus on key levels.
Tolerance for Touch Detection (%):
Adjust the grouping tolerance as a percentage of the price. For example, 1% groups levels that are within 1% of each other.
How to Use
Apply the Script:
Add the script to your TradingView chart, and it will automatically detect and plot support and resistance levels.
Analyze the Levels:
Use Resistance Levels (red lines) as potential sell zones or areas to place stop-loss orders above.
Use Support Levels (green lines) as potential buy zones or areas to place stop-loss orders below.
Customize for Your Trading Style:
Adjust the inputs to match your preferred strategy and the timeframe or asset you're analyzing.
Example Use Case
Imagine you're analyzing a stock:
Resistance Level: The script identifies resistance at $150 with 3 touches. This might be a potential sell zone if the price struggles to break through.
Support Level: The script identifies support at $130 with 4 touches. This might be a potential buy zone if the price shows signs of bouncing upward.
Key Features
Automatically detects and plots support and resistance levels.
Tracks the number of price touches to filter out weak levels.
Adapts dynamically to price ranges using a percentage-based tolerance.
Fully customizable to suit different trading styles and assets.
Clean and professional chart display with a limit on the number of lines.
Notes
This script is for educational purposes only and should not be considered financial advice.
Always perform your own analysis and manage risk before making trading decisions.
Why Use This Script?
The Godfather of Support & Resistance script simplifies your trading decisions by automating the detection of critical price levels. Whether you're a beginner or an experienced trader, this script is designed to save you time and help you focus on making informed trades.
Start using it today to master the art of support and resistance trading!
Let me know if you need further refinements for this description!
Clenow MomentumClenow Momentum Method
The Clenow Momentum Method, developed by Andreas Clenow, is a systematic, quantitative trading strategy focused on capturing medium- to long-term price trends in financial markets. Popularized through Clenow’s book, Stocks on the Move: Beating the Market with Hedge Fund Momentum Strategies, the method leverages momentum—an empirically observed phenomenon where assets that have performed well in the recent past tend to continue performing well in the near future.
Theoretical Foundation
Momentum investing is grounded in behavioral finance and market inefficiencies. Investors often exhibit herding behavior, underreact to new information, or chase trends, causing prices to trend beyond fundamental values. Clenow’s method builds on academic research, such as Jegadeesh and Titman (1993), which demonstrated that stocks with high returns over 3–12 months outperform those with low returns over similar periods.
Clenow’s approach specifically uses **annualized momentum**, calculated as the rate of return over a lookback period (typically 90 days), annualized to reflect a yearly percentage. The formula is:
Momentum=(((Close N periods agoCurrent Close)^N252)−1)×100
- Current Close: The most recent closing price.
- Close N periods ago: The closing price N periods back (e.g., 90 days).
- N: Lookback period (commonly 90 days).
- 252: Approximate trading days in a year for annualization.
This metric ranks stocks by their momentum, prioritizing those with the strongest upward trends. Clenow’s method also incorporates risk management, diversification, and volatility adjustments to enhance robustness.
Methodology
The Clenow Momentum Method involves the following steps:
1. Universe Selection:
- A broad universe of liquid stocks is chosen, often from major indices (e.g., S&P 500, Nasdaq 100) or global exchanges.
- Filters should exclude illiquid stocks (e.g., low average daily volume) or those with extreme volatility.
2. Momentum Calculation:
- Stocks are ranked based on their annualized momentum over a lookback period (typically 90 days, though 60–120 days can be common tests).
- The top-ranked stocks (e.g., top 10–20%) are selected for the portfolio.
3. Volatility Adjustment (Optional):
- Clenow sometimes adjusts momentum scores by volatility (e.g., dividing by the standard deviation of returns) to favor stocks with smoother trends.
- This reduces exposure to erratic price movements.
4. Portfolio Construction:
- A diversified portfolio of 10–25 stocks is constructed, with equal or volatility-weighted allocations.
- Position sizes are often adjusted based on risk (e.g., 1% of capital per position).
5. Rebalancing:
- The portfolio is rebalanced periodically (e.g., weekly or monthly) to maintain exposure to high-momentum stocks.
- Stocks falling below a momentum threshold are replaced with higher-ranked candidates.
6. Risk Management:
- Stop-losses or trailing stops may be applied to limit downside risk.
- Diversification across sectors reduces concentration risk.
Implementation in TradingView
Key features include:
- Customizable Lookback: Users can adjust the lookback period in pinescript (e.g., 90 days) to align with Clenow’s methodology.
- Visual Cues: Background colors (green for positive, red for negative momentum) and a zero line help identify trend strength.
- Integration with Screeners: TradingView’s stock screener can filter high-momentum stocks, which can then be analyzed with the custom indicator.
Strengths
1. Simplicity: The method is straightforward, relying on a single metric (momentum) that’s easy to calculate and interpret.
2. Empirical Support: Backed by decades of academic research and real-world hedge fund performance.
3. Adaptability: Applicable to stocks, ETFs, or other asset classes, with flexible lookback periods.
4. Risk Management: Diversification and periodic rebalancing reduce idiosyncratic risk.
5. TradingView Integration: Pine Script implementation enables real-time visualization, enhancing decision-making for stocks like NVDA or SPY.
Limitations
1. Mean Reversion Risk: Momentum can reverse sharply in bear markets or during sector rotations, leading to drawdowns.
2. Transaction Costs: Frequent rebalancing increases trading costs, especially for retail traders with high commissions. This is not as prevalent with commission free trading becoming more available.
3. Overfitting Risk: Over-optimizing lookback periods or filters can reduce out-of-sample performance.
4. Market Conditions: Underperforms in low-momentum or highly volatile markets.
Practical Applications
The Clenow Momentum Method is ideal for:
Retail Traders: Use TradingView’s screener to identify high-momentum stocks, then apply the Pine Script indicator to confirm trends.
Portfolio Managers: Build diversified momentum portfolios, rebalancing monthly to capture trends.
Swing Traders: Combine with volume filters to target short-term breakouts in high-momentum stocks.
Cross-Platform Workflow: Integrate with Python scanners to rank stocks, then visualize on TradingView for trade execution.
Comparison to Other Strategies
Vs. Minervini’s VCP: Clenow’s method is purely quantitative, while Minervini’s Volatility Contraction Pattern (your April 11, 2025 query) combines momentum with chart patterns. Clenow is more systematic but less discretionary.
Vs. Mean Reversion: Momentum bets on trend continuation, unlike mean reversion strategies that target oversold conditions.
Vs. Value Investing: Momentum outperforms in bull markets but may lag value strategies in recovery phases.
Conclusion
The Clenow Momentum Method is a robust, evidence-based strategy that capitalizes on price trends while managing risk through diversification and rebalancing. Its simplicity and adaptability make it accessible to retail traders, especially when implemented on platforms like TradingView with custom Pine Script indicators. Traders must be mindful of transaction costs, mean reversion risks, and market conditions. By combining Clenow’s momentum with volume filters and alerts, you can optimize its application for swing or position trading.

SMT SwiftEdge PowerhouseSMT SwiftEdge Powerhouse: Precision Trading with Divergence, Liquidity Grabs, and OTE Zones
The SMT SwiftEdge Powerhouse is a powerful trading tool designed to help traders identify high-probability entry points during the most active market sessions—London and New York. By combining Smart Money Technique (SMT) Divergence, Liquidity Grabs, and Optimal Trade Entry (OTE) Zones, this script provides a unique and cohesive strategy for capturing market reversals with precision. Whether you're a scalper or a swing trader, this indicator offers clear visual signals to enhance your trading decisions on any timeframe.
What Does This Script Do?
This script integrates three key concepts to identify potential trading opportunities:
SMT Divergence:
SMT Divergence compares the price action of two correlated assets (e.g., Nasdaq and S&P 500 futures) to detect hidden market reversals. When one asset makes a higher high while the other makes a lower high (bearish divergence), or one makes a lower low while the other makes a higher low (bullish divergence), it signals a potential reversal. This technique leverages institutional "smart money" behavior to anticipate market shifts.
Liquidity Grabs:
Liquidity Grabs occur when price breaks above recent highs or below recent lows on higher timeframes (5m and 15m), often triggering stop-loss orders from retail traders. These breakouts are identified using pivot points and confirm institutional activity, setting the stage for a reversal. The script focuses on liquidity grabs during the London and New York sessions for maximum market activity.
Optimal Trade Entry (OTE) Zones:
OTE Zones are Fibonacci-based retracement areas (e.g., 61.8%) calculated after a liquidity grab. These zones highlight where price is likely to retrace before continuing in the direction of the reversal, offering a high-probability entry point. The script adjusts the width of these zones using the Average True Range (ATR) to adapt to market volatility.
By combining these components, the script identifies when institutional activity (liquidity grabs) aligns with market reversals (SMT divergence) and pinpoints precise entry points (OTE zones) during high-liquidity sessions.
Why Combine These Components?
The integration of SMT Divergence, Liquidity Grabs, and OTE Zones creates a robust trading system for several reasons:
Synergy of Institutional Signals: SMT Divergence and Liquidity Grabs both reflect "smart money" behavior—divergence shows hidden reversals, while liquidity grabs confirm institutional intent to trap retail traders. Together, they provide a strong foundation for identifying high-probability setups.
Session-Based Precision: Focusing on the London and New York sessions ensures signals occur during periods of high volatility and liquidity, increasing their reliability.
Precision Entries with OTE: After confirming a setup with divergence and liquidity grabs, OTE zones provide a clear entry area, reducing guesswork and improving trade accuracy.
Adaptability: The script works on any timeframe, with adjustable settings for signal sensitivity, session times, and Fibonacci levels, making it versatile for different trading styles.
This combination makes the script unique by aligning institutional insights with actionable entry points, tailored to the most active market hours.
How to Use the Script
Setup:
Add the script to your chart (works on any timeframe, e.g., 1m, 5m, 15m).
Configure the settings in the indicator's inputs:
Session Settings: Adjust the start/end times for London and New York sessions (default: London 8-11 UTC, New York 13-16 UTC). You can disable session restrictions if desired.
Asset Settings: Set the primary and secondary assets for SMT Divergence (default: NQ1! and ES1!). Ensure the assets are correlated.
Signal Settings: Adjust the lookback period, ATR period, and signal sensitivity (Low/Medium/High) to control the frequency of signals.
OTE Settings: Choose the Fibonacci level for OTE zones (default: 61.8%).
Visual Settings: Enable/disable OTE zones, SMT labels, and debug labels for troubleshooting.
Interpreting Signals:
Blue Circles: Indicate a liquidity grab (price breaking a 5m or 15m pivot high/low), marking the start of a potential setup.
Blue OTE Zones: Appear after a liquidity grab, showing the retracement area (e.g., 61.8% Fibonacci level) where price is likely to enter for a reversal trade. The label "OTE Trigger 5m/15m" confirms the direction (Short/Long) and session.
Green/Red Entry Boxes: Mark precise entry points when price enters the OTE zone and confirms the SMT Divergence. Green boxes indicate a long entry, red boxes a short entry.
Trading Example:
On a 1m chart, a blue circle appears when price breaks a 5m pivot high during the London session.
A blue OTE zone forms, showing a retracement area (e.g., 61.8% Fibonacci level) with the label "OTE Trigger 5m/15m (Short, London)".
Price retraces into the OTE zone, and a red "Short Entry" box appears, confirming a bearish SMT Divergence.
Enter a short trade at the red box, with a stop-loss above the OTE zone and a take-profit at the next support level.
Originality and Utility
The SMT SwiftEdge Powerhouse stands out by merging SMT Divergence, Liquidity Grabs, and OTE Zones into a single, session-focused indicator. Unlike traditional indicators that focus on one aspect of price action, this script combines institutional reversal signals with precise entry zones, tailored to the most active market hours. Its adaptability across timeframes, customizable settings, and clear visual cues make it a versatile tool for traders seeking to capitalize on smart money movements with confidence.
Tips for Best Results
Use on correlated assets like NQ1! (Nasdaq futures) and ES1! (S&P 500 futures) for accurate SMT Divergence.
Test on lower timeframes (1m, 5m) for scalping or higher timeframes (15m, 1H) for swing trading.
Adjust the "Signal Sensitivity" to "High" for more signals or "Low" for fewer, high-quality setups.
Enable "Show Debug Labels" if signals are not appearing as expected, to troubleshoot pivot points and liquidity grabs.

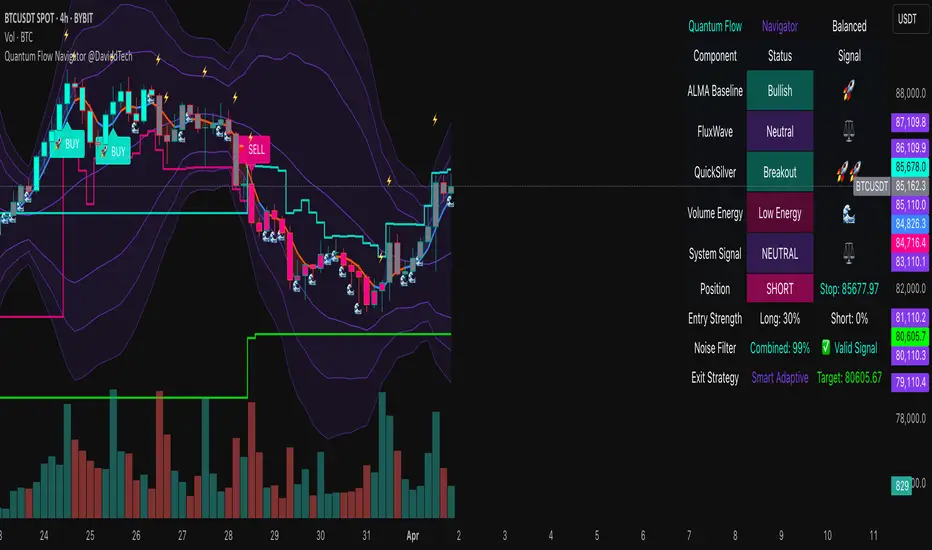
Quantum Flow Navigator @DaviddTechQuantum Flow Navigator – DaviddTech
Precision Strategy Builder Powered by Adaptive Filters, Statistical Noise Reduction & Multi-Modal Confirmation
🚀 Bullish Signal : Enter when ALMA, FluxWave, and QuickSilver all confirm bullish trend, with high volume and valid noise filter state.
🔻 Bearish Signal : Enter short when all components align bearishly and filters validate the signal.
🚪 Exit : Automatically managed by dynamic SL/TP or indicator-based reversal logic.
✅ Overview & DaviddTech Methodology
Quantum Flow Navigator is an advanced, multi-component trading system engineered around the strict modular logic of the DaviddTech methodology .
It integrates every core component required for a fully rule-based and signal-driven strategy—baseline, confirmations, volume filter, exit system, and noise filter.
Designed for traders who demand structure, clarity, and data-backed decision-making on 15M, 1H, and 4H charts.
🔍 Indicator Components
Baseline: Adaptive ALMA Filter
Smooth and responsive dynamic trend detection, with momentum validation and optional filled zones for enhanced visual feedback.
Confirmation #1: FluxWave Oscillator
Developed from an enhanced Trendlio concept by @dudeowns , FluxWave uses ALMA-smoothed rate-of-change logic with configurable signal behavior.
Confirmation #2: QuickSilver Band System
Custom breakout engine that maps volatility envelopes using multi-layered deviation bands for clear confirmation of structure breaks and trend direction.
Volume Filter: Normalized Volume Energy
Innovative volume filter inspired by @ceyhun 's work. Filters trades by classifying energy into High, Normal, or Low based on normalized volume context.
Exit System: Dynamic Momentum Stop Loss
Choose from Smart Adaptive, Trailing, Stepped, Percentage, ATR, or Volatility-adjusted logic. Supports TP via risk/reward, ATR multiples, or percentage targets.
Noise Filtration: Quantum Statistical Noise Reduction
Fuses Kalman smoothing with wavelet decomposition to eliminate non-signal noise and improve trade quality and confidence.
🎨 Visual System & Dashboard
🚀/🔻/🚪 Emoji Labels : Buy, sell, and exit trades clearly marked for instant recognition.
Color-Shifting Bars : Reflect FluxWave’s trend bias in real-time.
ALMA Fill Zone : Visual trend envelope between price and ALMA baseline.
QuickSilver Bands : Volatility envelopes with graduated depth for support/resistance awareness.
SL & TP Visuals : Dynamic stop-loss and take-profit zones plotted directly on chart.
Navigator Panel : In-chart dashboard displays real-time trend status, volume energy, noise filter state, signal strength, and active position tracking.
📈 How to Trade with It
Entry Mode Selection : Choose between Combined, ALMA, FluxWave, QuickSilver, or Custom scoring logic.
Final Signals : Trigger only when confirmations align, volume energy is valid, and noise is low.
Dashboard Summary : Use real-time signal display to validate entry strength.
Timeframes : 15M–1H recommended for swing/intraday setups; 5M–15M for automation.
💡 Advanced Features
Entry Strength Scoring: Composite weight of all active components + filters.
Cooldown System: Limits excessive signals in volatile periods.
Multiple Exit Strategies: SL & TP modes with optional indicator-based exits.
Statistical Filtering: Wavelet + Kalman combination optimizes entry confidence.
Full Alert Suite: Covers entries, exits, filter triggers, volume states, and more.
🧠 Suggested Strategy Usage
Wait for full confirmation from ALMA, FluxWave, and QuickSilver.
Ensure volume energy is High and noise filter confirms trend clarity.
Use adaptive SL/TP or indicator-based exits.
Monitor dashboard for live signal strength ≥ threshold.
Use “Balanced” mode for general use; switch to “Aggressive” for tighter signals.
📝 Credits & Originality
Concept based on DaviddTech’s component-driven methodology .
FluxWave Oscillator built as an evolved version of Trendlio with full signal customization — credit @dudeowns .
Volume Energy Filter adapted from the work of @ceyhun .
Noise filtration and system architecture developed independently using Pine Script v6.
All code and logic is original, non-rehashed, and completely refactored to ensure uniqueness.
Quantum Flow Navigator fuses adaptive baselines, confirmation logic, energy-based filters, and statistical refinement into a precision signal engine—optimized for traders who value structure, clarity, and control.
Rogue ORB PRORogue ORB Pro is a precision-engineered Opening Range Breakout (ORB) indicator built for active intraday traders who need real signals, not noise.
This tool identifies high-probability breakout entries from the opening range, enhanced with optional ATR-based stop loss levels, deviation targets, cooldown filters, and a relative volume gate to filter weak setups.
🔍 Key Features:
Opening Range High/Low: Drawn from a user-defined time window and locked for the day
Deviations: Automatically plots target zones above and below the OR range (e.g. 1, 2 deviations)
Pre-Market Levels: Automatically draws pre market high and low lines at the end of pre market session
Buy/Sell Signals: Triggered on breakout of the OR High/Low with configurable breakout logic (touch or close)
ATR Stop Loss Line: Dynamically drawn at a fixed ATR distance from breakout candle, with optional SL label
Cooldown Period: Prevents back-to-back signals by enforcing a user-defined bar delay between entries, can help with overtrading
Volume Filter: Optional relative volume filter that requires breakout candles to exceed a custom volume threshold
VWAP Overlay: Visual VWAP for directional bias and confluence

Reversal Strength Meter – Adib NooraniThe Reversal Strength Meter is an oscillator designed to identify potential reversal zones based on supply and demand dynamics. It uses smoothed stochastic logic to reduce noise and highlight areas where momentum may be weakening, signaling possible market turning points.
🔹 Smooth, noise-reduced stochastic oscillator
🔹 Custom zones to highlight potential supply and demand imbalances
🔹 Non-repainting, compatible across all timeframes and assets
🔹 Visual-only tool — intended to support discretionary trading decisions
This oscillator assists scalpers and intraday traders in tracking subtle shifts in momentum, helping them identify when a market may be preparing to reverse — always keeping in mind that trading is based on probabilities, not certainties.
📘 How to Use the Indicator Efficiently
For Reversal Trading:
Buy Setup
– When the blue line dips below the 20 level, wait for it to re-enter above 20.
– Look for reversal candlestick patterns (e.g., bullish engulfing, hammer, or morning star).
– Enter above the pattern’s high, with a stop loss below its low.
Sell Setup
– When the blue line rises above the 80 level, wait for it to re-enter below 80.
– Look for bearish candlestick patterns (e.g., bearish engulfing, inverted hammer, or evening star).
– Enter below the pattern’s low, with a stop loss above its high.
🛡 Risk Management Guidelines
Risk only 0.5% of your capital per trade
Book 50% profits at a 1:1 risk-reward ratio
Trail the remaining 50% using price action or other supporting indicators

Reversal Scalping Ribbon - Adib NooraniThe Reversal Scalping Ribbon is a trend-following overlay tool designed to visually identify potential reversal zones based on price extremes and dynamic volatility bands. It calculates adaptive upper and lower bands using price action and custom ATR logic, helping traders quickly assess market direction and possible turning points
🔹 Volatility-adjusted bands based on price highs/lows
🔹 Color-coded ribbons to indicate trend bias and potential reversal shifts
🔹 No repainting, works on all timeframes and assets
🔹 Visual-only display, no trade signals — supports discretion-based entries
This ribbon is designed for scalpers and intraday traders to spot reversal setups with clarity. It enhances your trading by showing real-time market bias without unnecessary distractions. By focusing on probabilities, it helps to improve decision-making in fast-paced environments
How to use the indicator efficiently
For Reversal Trading:
Buy: When price closes below the green ribbon with a red candle, then re-enters with a green candle. Enter above the high of the green candle with a stop loss below the lowest low of the recent green/red candles
Sell: When price closes above the red ribbon with a green candle, then re-enters with a red candle. Enter below the low of the red candle with a stop loss above the highest high of the recent red/green candles
Risk Management:
Limit risk to 0.5% of your capital per trade
Take 50% profit at a 1:1 risk-reward ratio
For the remaining 50%, trail using the lower edge of the green band for buys and the upper edge of the red band for sells

Quarterly Theory ICT 04 [TradingFinder] SSMT 4Quarter Divergence🔵 Introduction
Sequential SMT Divergence is an advanced price-action-based analytical technique rooted in the ICT (Inner Circle Trader) methodology. Its primary objective is to identify early-stage divergences between correlated assets within precise time structures. This tool not only breaks down market structure but also enables traders to detect engineered liquidity traps before the market reacts.
In simple terms, SMT (Smart Money Technique) occurs when two correlated assets—such as indices (ES and NQ), currency pairs (EURUSD and GBPUSD), or commodities (Gold and Silver)—exhibit different reactions at key price levels (swing highs or lows). This lack of alignment is often a sign of smart money manipulation and signals a lack of confirmation in the ongoing trend—hinting at an imminent reversal or at least a pause in momentum.
In its Sequential form, SMT divergences are examined through a more granular temporal lens—between intraday quarters (Q1 through Q4). When SMT appears at the transition from one quarter to another (e.g., Q1 to Q2 or Q3 to Q4), the signal becomes significantly more powerful, often aligning with a critical phase in the Quarterly Theory—a framework that segments market behavior into four distinct phases: Accumulation, Manipulation, Distribution, and Reversal/Continuation.
For instance, a Bullish SMT forms when one asset prints a new low while its correlated counterpart fails to break the corresponding low from the previous quarter. This usually indicates absorption of selling pressure and the beginning of accumulation by smart money. Conversely, a Bearish SMT arises when one asset makes a higher high, but the second asset fails to confirm, signaling distribution or a fake-out before a decline.
However, SMT alone is not enough. To confirm a true Market Structure Break (MSB), the appearance of a Precision Swing Point (PSP) is essential—a specific candlestick formation on a lower timeframe (typically 5 to 15 minutes) that reveals the entry of institutional participants. The combination of SMT and PSP provides a more accurate entry point and better understanding of premium and discount zones.
The Sequential SMT Indicator, introduced in this article, dynamically scans charts for such divergence patterns across multiple sessions. It is applicable to various markets including Forex, crypto, commodities, and indices, and shows particularly strong performance during mid-week sessions (Wednesdays and Thursdays)—when most weekly highs and lows tend to form.
Bullish Sequential SMT :
Bearish Sequential SMT :
🔵 How to Use
The Sequential SMT (SSMT) indicator is designed to detect time and structure-based divergences between two correlated assets. This divergence occurs when both assets print a similar swing (high or low) in the previous quarter (e.g., Q3), but in the current quarter (e.g., Q4), only one asset manages to break that swing level—while the other fails to reach it.
This temporal mismatch is precisely identified by the SSMT indicator and often signals smart money activity, a market phase transition, or even the presence of an engineered liquidity trap. The signal becomes especially powerful when paired with a Precision Swing Point (PSP)—a confirming candle on lower timeframes (5m–15m) that typically indicates a market structure break (MSB) and the entry of smart liquidity.
🟣 Bullish Sequential SMT
In the previous quarter, both assets form a similar swing low.
In the current quarter, one asset (e.g., EURUSD) breaks that low and trades below it.
The other asset (e.g., GBPUSD) fails to reach the same low, preserving the structure.
This time-based divergence reflects declining selling pressure, potential absorption, and often marks the end of a manipulation phase and the start of accumulation. If confirmed by a bullish PSP candle, it offers a strong long opportunity, with stop-losses defined just below the swing low.
🟣 Bearish Sequential SMT
In the previous quarter, both assets form a similar swing high.
In the current quarter, one asset (e.g., NQ) breaks above that high.
The other asset (e.g., ES) fails to reach that high, remaining below it.
This type of divergence signals weakening bullish momentum and the likelihood of distribution or a fake-out before a price drop. When followed by a bearish PSP candle, it sets up a strong shorting opportunity with targets in the discount zone and protective stops placed above the swing high.
🔵 Settings
⚙️ Logical Settings
Quarterly Cycles Type : Select the time segmentation method for SMT analysis.
Available modes include: Yearly, Monthly, Weekly, Daily, 90 Minute, and Micro.
These define how the indicator divides market time into Q1–Q4 cycles.
Symbol : Choose the secondary asset to compare with the main chart asset (e.g., XAUUSD, US100, GBPUSD).
Pivot Period : Sets the sensitivity of the pivot detection algorithm. A smaller value increases responsiveness to price swings.
Activate Max Pivot Back : When enabled, limits the maximum number of past pivots to be considered for divergence detection.
Max Pivot Back Length : Defines how many past pivots can be used (if the above toggle is active).
Pivot Sync Threshold : The maximum allowed difference (in bars) between pivots of the two assets for them to be compared.
Validity Pivot Length : Defines the time window (in bars) during which a divergence remains valid before it's considered outdated.
🎨 Display Settings
Show Cycle :Toggles the visual display of the current Quarter (Q1 to Q4) based on the selected time segmentation
Show Cycle Label : Shows the name (e.g., "Q2") of each detected Quarter on the chart.
Show Bullish SMT Line : Draws a line connecting the bullish divergence points.
Show Bullish SMT Label : Displays a label on the chart when a bullish divergence is detected.
Bullish Color : Sets the color for bullish SMT markers (label, shape, and line).
Show Bearish SMT Line : Draws a line for bearish divergence.
Show Bearish SMT Label : Displays a label when a bearish SMT divergence is found.
Bearish Color : Sets the color for bearish SMT visual elements.
🔔 Alert Settings
Alert Name : Custom name for the alert messages (used in TradingView’s alert system).
Message Frequency :
All: Every signal triggers an alert.
Once Per Bar: Alerts once per bar regardless of how many signals occur.
Per Bar Close: Only triggers when the bar closes and the signal still exists.
Time Zone Display : Choose the time zone in which alert timestamps are displayed (e.g., UTC).
Bullish SMT Divergence Alert : Enable/disable alerts specifically for bullish signals.
Bearish SMT Divergence Alert : Enable/disable alerts specifically for bearish signals
🔵 Conclusion
The Sequential SMT (SSMT) indicator is a powerful and precise tool for identifying structural divergences between correlated assets within a time-based framework. Unlike traditional divergence models that rely solely on sequential pivot comparisons, SSMT leverages Quarterly Theory, in combination with concepts like liquidity sweeps, market structure breaks (MSB) and precision swing points (PSP), to provide a deeper and more actionable view of market dynamics.
By using SSMT, traders gain not only the ability to identify where divergence occurs, but also when it matters most within the market cycle. This empowers them to anticipate major moves or traps before they fully materialize, and position themselves accordingly in high-probability trade zones.
Whether you're trading Forex, crypto, indices, or commodities, the true strength of this indicator is revealed when used in sync with the Accumulation, Manipulation, Distribution, and Reversal phases of the market. Integrated with other confluence tools and market models, SSMT can serve as a core component in a professional, rule-based, and highly personalized trading strategy.
