24/9 EMA with Bias & SignalsThis is a simple indicator that plots the 24 & 9 EMAs.
It also highlights the potential bias of the market (bull or bear) based on if the 9 EMA is above or below the 24 EMA.
In addition there are signal crosses that you can use for alerts.
This indicator is best used to confirm a particular underlying bias on the 5m, 15M, 1HR, 4HR, and Daily timeframes.
It's important to note on lower timeframes that the bias can be counter trend bias of the overall larger momentum of the instrument you are trading.
For clarity this means that many retraces get going when the 9 crosses the 24. But ultimately the larger timeframe bias will continue after this counter trend retraces.
Combining this indicator with value channels and ATR is what I recommend.
Komut dosyalarını "豪24配债" için ara


MTF 24-hour Volume [Anan]█ OVERVIEW
Tradingview added a new 24-hour Volume indicator to Pine. It’s designed to calculate the volume of daily trading turnover in a particular currency.
It works in the same way as the well-known Volume indicator does. The difference is that 24-hour Volume is a metric used to track the total value of all transactions within a 24-hour period. It can be used to measure market interest in a specific currency over the past day and night. You can read more about how the 24-hour Volume indicator works in Help Center .
█ FEATURES
- Multi Time Frames up to four customizable slots.
- Volume Change by "quote" currency.
- Volume Change %.
- Volume MA Change %.
- Control table colors/position as you like.
**Designed to work with Crypto pairs**

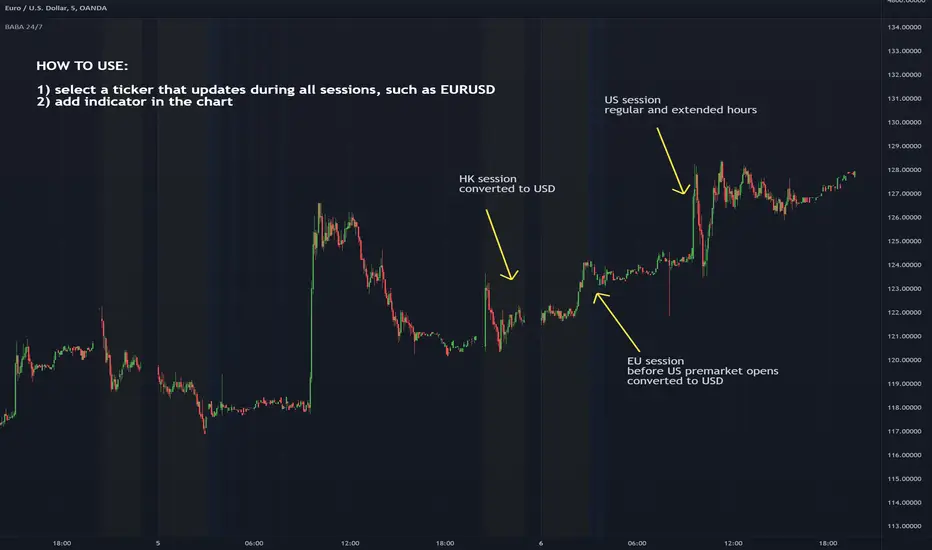
BABA 24/7 - Alibaba price chart all exchanges combinedThis script combines Alibaba stock price from NYSE, HKEX and XETRA (EU) exchanges into one chart. It handles currency and ADR conversions automatically and price is always shown in USD.
NOTE!! You must add the indicator in a chart that updates 24/7, such as EURUSD. If you use a chart that updates only during US session (such as BABA), HK/EU sessions will not be shown.
If you want to add indicators in the chart, hover your mouse over indicator title "BABA 24/7" in the upper left corner of the chart, select the rightmost button "..." that appears and then Add indicator/Strategy.
RSI 6/14/24 by HC3 timeframes of RSIs: 6, 14 and 24 days. This is the extended version of the "standard" RSI script.
How to use it:
It has 3 upper bands and 3 lower bands. The 6-day RSI (orange line) corresponds to 80 and 20 bands, which means if 6-day RSI is over 80, it is an indicator of overbought for short term. Similarly, 14-day RSI use 70 and 30 bands and 24-day RSI use 60 and 40 bands. But these are not the "magic numbers". For different investments, they may have different thresholds. You can change it in the setting.
We all know when RSI is high, it may be an indicator to sell the investments we are holding. However, if 6-day RSI > 80, but 14-day RSI <70, it may not be the good time to sell it right now. We may watch it for a few days. But if all 3 RSIs are above the corresponding upper bands, it may be the time to sell it.
When the orange line down crosses the purple and blue lines, the price is dropping down. On the contrary, when the orange line up crosses the purple and blue lines, the price is probably up.
Let me know if you have any question.
Holly
2020.12.05

Multi-timeframe 24 moving averages + BB+SAR+Supertrend+VWAP █ OVERVIEW
The script allows to display up to 24 moving averages ("MA"'s) across 5 timeframes plus two bands (Bollinger Bands or Supertrend or Parabolic SAR or VWAP bands) each from its own timeframe.
The main difference of this script from many similar ones is the flexibility of its settings:
- Bulk enable/disable and/or change properties of several MAs at once.
- Save 3 of your frequently used templates as presets using CSV text configurations.
█ HOW TO USE
Some use examples:
In order to "show 31, 50, 200 EMAs and 20, 100, 200 SMAs for each of 1H, 4H, D, W, M timeframes using blue for short MA, yellow for mid MA and red for long MA" use the settings as shown on a screenshot below.
In order to "Show a band of chart timeframe MA's of lengths 5, 8, 13, 21, 34, 55, 100 and 200 plus some 1H, 4H, D and W MAs. Be able to quickly switch off the band of chart tf's MAs. For chart timeframe MA's only show labels for 21, 100 and 200 EMAs". You can set TF1 and TF2 to chart's TF and set you fib MAs there and configure fixed higher timeframe MAs using TF3, TF4 and TF5 (e.g. using 1H, D and W timeframes and using 1H 800 in place of 4H 200 MA). However, quicker way may be using CSV - the syntax is very simple and intuitive, see Preset 2 as it comes in the script. You can easily switch chart tf's band of MAs by toggling on/off your chart timeframe TF's (in our example, TF1 and TF2).
The settings are either obvious or explained in tooltips.
Note 1: When using group settings and CSV presets do not forget that individual setting affected will no have any effect. So, if some setting does not work, check whether it is overridden with some group setting or a CSV preset.
Note 2: Sometimes you can notice parts of MA's hanging in the air, not lasting up to the last bar. This is not a bug as explained on this screenshot:
█ FOR DEVELOPERS
The script is a use case of my CSVParser library, which in turn uses Autotable library, both of which I hope will be quite helpful. Autotable is so powerful and comprehensive that you will hardly ever wish to use normal table functions again for complex tables.
The indicator was inspired by Pablo Limonetti's url=https://www.tradingview.com/script/nFs56VUZ/]Multi Timeframe Moving Averages and Raging @RagingRocketBull's # Multi SMA EMA WMA HMA BB (5x8 MAs Bollinger Bands) MAX MTF - RRB

BBI MA(6/12/24)This Bear Bull Index ( BBI ) is only consider 3 moving averages i.e. SMA (6), SMA (12) and SMA (24). BBI likely moving average, it tells you the trend, beside it is the support and resistance line against the share price. The share price will ride on the BBI wave and earn big so long the share price is maintained above the BBI line.

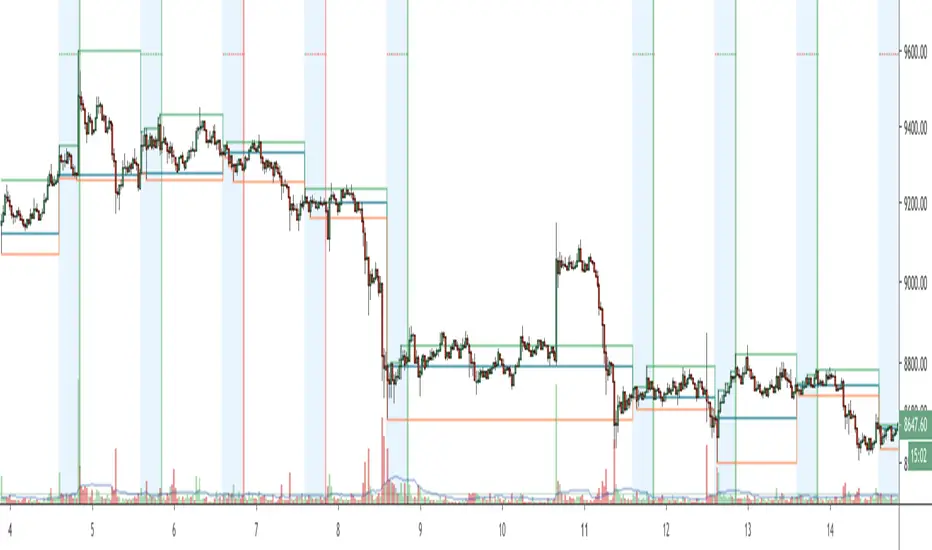
NYSE Session for 24/7 marketsThis script is used for analyzing the correlation between 24/7 markets with regards to the price action during NYSE session. Defaults to showing daily session open/high/low but there is the option to show the weekly session data.
Dukhan: 24 Hours rolling volumeShows rolling volume for 24 hours as exchanges does
default settings is for 1m candles
Inputs:
p = Period : is the number of candle to aggregate to the back, i.e for 1m candle there is 1440 candle in one day
for 5m candles as example: 24h * 60 / 5 = 288
so for 5m you have to change input p to be 288
Plots:
Red line is total volume
white line is per candle volume change from the previous one

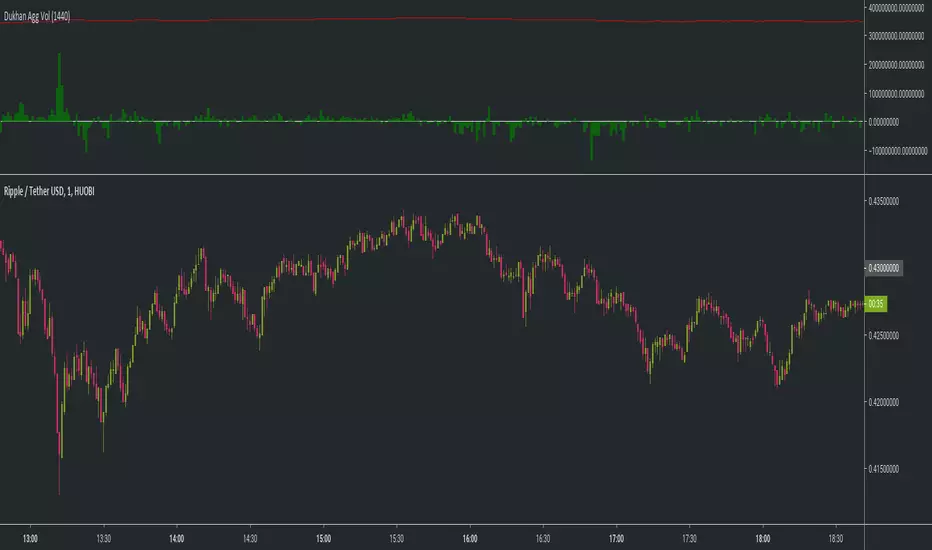
Dukhan 24 Hours rolling volume similar to exchanges Shows 24 hour rolling volume similar to the exchange - Done for BTC but works on anything
input is number of candle to calculate back
usage:
1m candle : 24h * 60 = 1440
5m candle: (24h * 60) / 5 = 288
etc

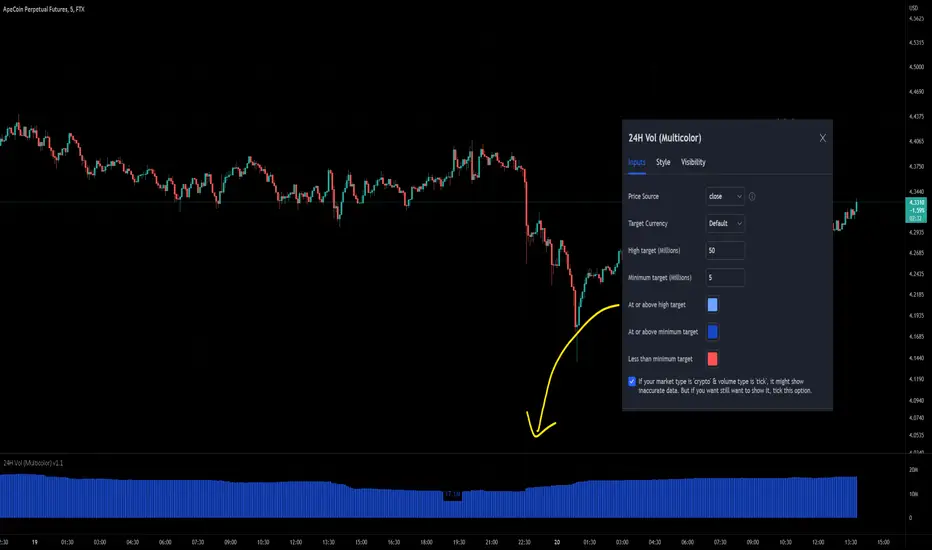
24-hour Volume (Multi-color with target size)This indicator has added the option to set different colors for a size target so you can set and instantly knows if the volume is above or below your target by seeing the different colors. Furthermore, I've added the option to opt-out of the error message that blocked the use of the 'crypto' market with the 'tick' type because maybe some users needed it, for example: BYBIT:APEUSDT is by default not available but personally I want to see it, so I can turn it on in this script.
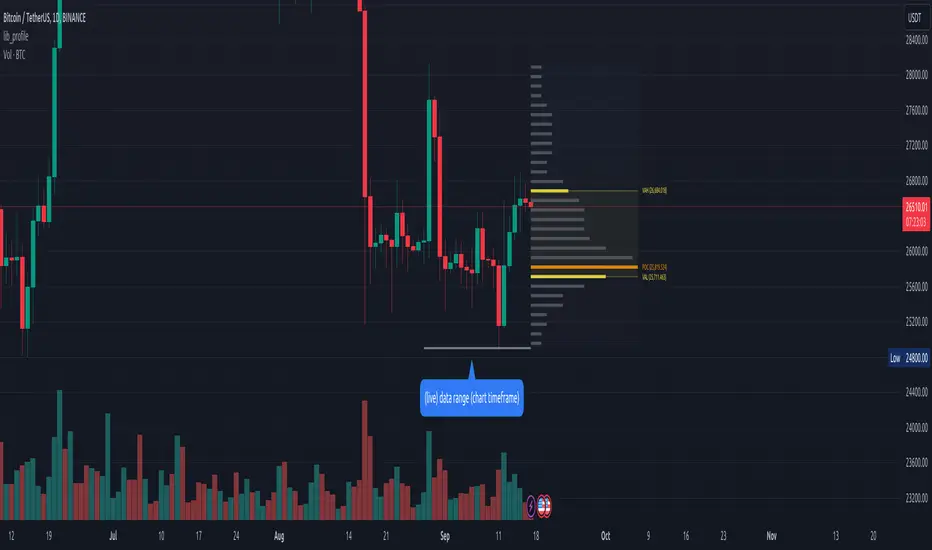
lib_profileLibrary "lib_profile"
a library with functions to calculate a volume profile for either a set of candles within the current chart, or a single candle from its lower timeframe security data. All you need is to feed the
method delete(this)
deletes this bucket's plot from the chart
Namespace types: Bucket
Parameters:
this (Bucket)
method delete(this)
Namespace types: Profile
Parameters:
this (Profile)
method delete(this)
Namespace types: Bucket
Parameters:
this (Bucket )
method delete(this)
Namespace types: Profile
Parameters:
this (Profile )
method update(this, top, bottom, value, fraction)
updates this bucket's data
Namespace types: Bucket
Parameters:
this (Bucket)
top (float)
bottom (float)
value (float)
fraction (float)
method update(this, tops, bottoms, values)
update this Profile's data (recalculates the whole profile and applies the result to this object) TODO optimisation to calculate this incremental to improve performance in realtime on high resolution
Namespace types: Profile
Parameters:
this (Profile)
tops (float ) : array of range top/high values (either from ltf or chart candles using history() function
bottoms (float ) : array of range bottom/low values (either from ltf or chart candles using history() function
values (float ) : array of range volume/1 values (either from ltf or chart candles using history() function (1s can be used for analysing candles in bucket/price range over time)
method tostring(this)
allows debug print of a bucket
Namespace types: Bucket
Parameters:
this (Bucket)
method draw(this, start_t, start_i, end_t, end_i, args, line_color)
allows drawing a line in a Profile, representing this bucket and it's value + it's value's fraction of the Profile total value
Namespace types: Bucket
Parameters:
this (Bucket)
start_t (int) : the time x coordinate of the line's left end (depends on the Profile box)
start_i (int) : the bar_index x coordinate of the line's left end (depends on the Profile box)
end_t (int) : the time x coordinate of the line's right end (depends on the Profile box)
end_i (int) : the bar_index x coordinate of the line's right end (depends on the Profile box)
args (LineArgs type from robbatt/lib_plot_objects/24) : the default arguments for the line style
line_color (color) : the color override for POC/VAH/VAL lines
method draw(this, forced_width)
draw all components of this Profile (Box, Background, Bucket lines, POC/VAH/VAL overlay levels and labels)
Namespace types: Profile
Parameters:
this (Profile)
forced_width (int) : allows to force width of the Profile Box, overrides the ProfileArgs.default_size and ProfileArgs.extend arguments (default: na)
method init(this)
Namespace types: ProfileArgs
Parameters:
this (ProfileArgs)
method init(this)
Namespace types: Profile
Parameters:
this (Profile)
profile(tops, bottoms, values, resolution, vah_pc, val_pc, bucket_buffer)
split a chart/parent bar into 'resolution' sections, figure out in which section the most volume/time was spent, by analysing a given set of (intra)bars' top/bottom/volume values. Then return price center of the bin with the highest volume, essentially marking the point of control / highest volume (poc) in the chart/parent bar.
Parameters:
tops (float ) : array of range top/high values (either from ltf or chart candles using history() function
bottoms (float ) : array of range bottom/low values (either from ltf or chart candles using history() function
values (float ) : array of range volume/1 values (either from ltf or chart candles using history() function (1s can be used for analysing candles in bucket/price range over time)
resolution (int) : amount of buckets/price ranges to sort the candle data into (analyse how much volume / time was spent in a certain bucket/price range) (default: 25)
vah_pc (float) : a threshold percentage (of values' total) for the top end of the value area (default: 80)
val_pc (float) : a threshold percentage (of values' total) for the bottom end of the value area (default: 20)
bucket_buffer (Bucket ) : optional buffer of empty Buckets to fill, if omitted a new one is created and returned. The buffer length must match the resolution
Returns: poc (price level), vah (price level), val (price level), poc_index (idx in buckets), vah_index (idx in buckets), val_index (idx in buckets), buckets (filled buffer or new)
create_profile(start_idx, tops, bottoms, values, resolution, vah_pc, val_pc, args)
split a chart/parent bar into 'resolution' sections, figure out in which section the most volume/time was spent, by analysing a given set of (intra)bars' top/bottom/volume values. Then return price center of the bin with the highest volume, essentially marking the point of control / highest volume (poc) in the chart/parent bar.
Parameters:
start_idx (int) : the bar_index at which the Profile should start drawing
tops (float ) : array of range top/high values (either from ltf or chart candles using history() function
bottoms (float ) : array of range bottom/low values (either from ltf or chart candles using history() function
values (float ) : array of range volume/1 values (either from ltf or chart candles using history() function (1s can be used for analysing candles in bucket/price range over time)
resolution (int) : amount of buckets/price ranges to sort the candle data into (analyse how much volume / time was spent in a certain bucket/price range) (default: 25)
vah_pc (float) : a threshold percentage (of values' total) for the top end of the value area (default: 80)
val_pc (float) : a threshold percentage (of values' total) for the bottom end of the value area (default: 20)
args (ProfileArgs)
Returns: poc (price level), vah (price level), val (price level), poc_index (idx in buckets), vah_index (idx in buckets), val_index (idx in buckets), buckets (filled buffer or new)
history(src, len, offset)
allows fetching an array of values from the history series with offset from current candle
Parameters:
src (int)
len (int)
offset (int)
history(src, len, offset)
allows fetching an array of values from the history series with offset from current candle
Parameters:
src (float)
len (int)
offset (int)
history(src, len, offset)
allows fetching an array of values from the history series with offset from current candle
Parameters:
src (bool)
len (int)
offset (int)
history(src, len, offset)
allows fetching an array of values from the history series with offset from current candle
Parameters:
src (string)
len (int)
offset (int)
Bucket
Fields:
idx (series int) : the index of this Bucket within the Profile starting with 0 for the lowest Bucket at the bottom of the Profile
value (series float) : the value of this Bucket, can be volume or time, for using time pass and array of 1s to the update function
top (series float) : the top of this Bucket's price range (for calculation)
btm (series float) : the bottom of this Bucket's price range (for calculation)
center (series float) : the center of this Bucket's price range (for plotting)
fraction (series float) : the fraction this Bucket's value is compared to the total of the Profile
plot_bucket_line (Line type from robbatt/lib_plot_objects/24) : the line that resembles this bucket and it's valeu in the Profile
ProfileArgs
Fields:
show_poc (series bool) : whether to plot a POC line across the Profile Box (default: true)
show_profile (series bool) : whether to plot a line for each Bucket in the Profile Box, indicating the value per Bucket (Price range), e.g. volume that occured in a certain time and price range (default: false)
show_va (series bool) : whether to plot a VAH/VAL line across the Profile Box (default: false)
show_va_fill (series bool) : whether to fill the 'value' area between VAH/VAL line (default: false)
show_background (series bool) : whether to fill the Profile Box with a background color (default: false)
show_labels (series bool) : whether to add labels to the right end of the POC/VAH/VAL line (default: false)
show_price_levels (series bool) : whether add price values to the labels to the right end of the POC/VAH/VAL line (default: false)
extend (series bool) : whether extend the Profile Box to the current candle (default: false)
default_size (series int) : the default min. width of the Profile Box (default: 30)
args_poc_line (LineArgs type from robbatt/lib_plot_objects/24) : arguments for the poc line plot
args_va_line (LineArgs type from robbatt/lib_plot_objects/24) : arguments for the va line plot
args_poc_label (LabelArgs type from robbatt/lib_plot_objects/24) : arguments for the poc label plot
args_va_label (LabelArgs type from robbatt/lib_plot_objects/24) : arguments for the va label plot
args_profile_line (LineArgs type from robbatt/lib_plot_objects/24) : arguments for the Bucket line plots
args_profile_bg (BoxArgs type from robbatt/lib_plot_objects/24)
va_fill_color (series color) : color for the va area fill plot
Profile
Fields:
start (series int) : left x coordinate for the Profile Box
end (series int) : right x coordinate for the Profile Box
resolution (series int) : the amount of buckets/price ranges the Profile will dissect the data into
vah_threshold_pc (series float) : the percentage of the total data value to mark the upper threshold for the main value area
val_threshold_pc (series float) : the percentage of the total data value to mark the lower threshold for the main value area
args (ProfileArgs) : the style arguments for the Profile Box
h (series float) : the highest price of the data
l (series float) : the lowest price of the data
total (series float) : the total data value (e.g. volume of all candles, or just one each to analyse candle distribution over time)
buckets (Bucket ) : the Bucket objects holding the data for each price range bucket
poc_bucket_index (series int) : the Bucket index in buckets, that holds the poc Bucket
vah_bucket_index (series int) : the Bucket index in buckets, that holds the vah Bucket
val_bucket_index (series int) : the Bucket index in buckets, that holds the val Bucket
poc (series float) : the according price level marking the Point Of Control
vah (series float) : the according price level marking the Value Area High
val (series float) : the according price level marking the Value Area Low
plot_poc (Line type from robbatt/lib_plot_objects/24)
plot_vah (Line type from robbatt/lib_plot_objects/24)
plot_val (Line type from robbatt/lib_plot_objects/24)
plot_poc_label (Label type from robbatt/lib_plot_objects/24)
plot_vah_label (Label type from robbatt/lib_plot_objects/24)
plot_val_label (Label type from robbatt/lib_plot_objects/24)
plot_va_fill (LineFill type from robbatt/lib_plot_objects/24)
plot_profile_bg (Box type from robbatt/lib_plot_objects/24)
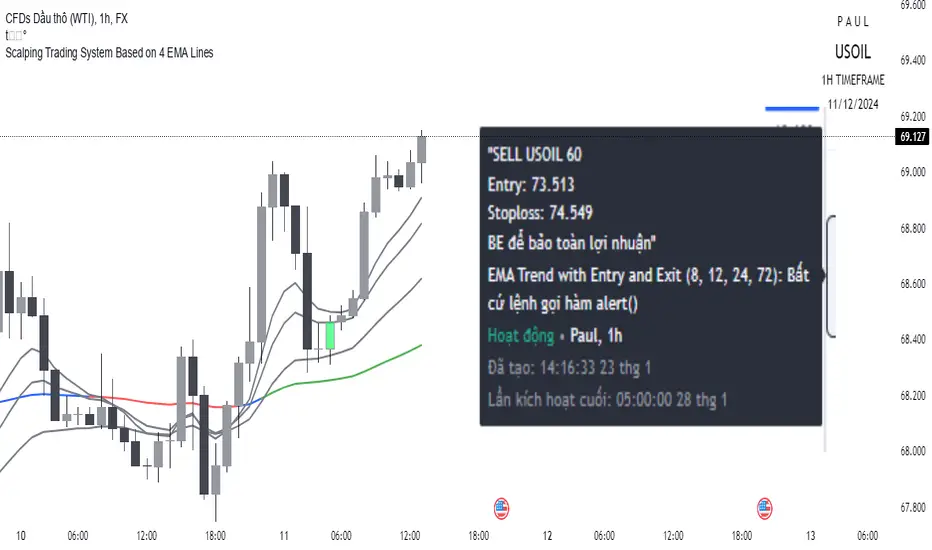
Scalping trading system based on 4 ema linesScalping Trading System Based on 4 EMA Lines
Overview:
This is a scalping trading strategy built on signals from 4 EMA moving averages: EMA(8), EMA(12), EMA(24) and EMA(72).
Conditions:
- Time frame: H1 (1 hour).
- Trading assets: Applicable to major currency pairs with high volatility
- Risk management: Use a maximum of 1-2% of capital for each transaction. The order holding time can be from a few hours to a few days, depending on the price fluctuation amplitude.
Trading rules:
Determine the main trend:
Uptrend: EMA(8), EMA(12) and EMA(24) are above EMA(72).
Downtrend: EMA(8), EMA(12) and EMA(24) are below EMA(72).
Trade in the direction of the main trend** (buy in an uptrend and sell in a downtrend).
Entry conditions:
- Only trade in a clearly trending market.
Uptrend:
- Wait for the price to correct to the EMA(24).
- Enter a buy order when the price closes above the EMA(24).
- Place a stop loss below the bottom of the EMA(24) candle that has just been swept.
Downtrend:
- Wait for the price to correct to the EMA(24).
- Enter a sell order when the price closes below the EMA(24).
- Place a stop loss above the top of the EMA(24) candle that has just been swept.
Take profit and order management:
- Take profit when the price moves 20 to 40 pips in the direction of the trade.
Use Trailing Stop to optimize profits instead of setting a fixed Take Profit.
Note:
- Do not trade within 30 minutes before and after the announcement of important economic news, as the price may fluctuate abnormally.
Additional filters:
To increase the success rate and reduce noise, this strategy uses additional conditions:
1. The price is calculated only when the candle closes (no repaint).
2. When sweeping through EMA(24), the price needs to close above EMA(24).
3. The closing price must be higher than 50% of the candle's length.
4. **The bottom of the candle sweeping through EMA(24) must be lower than the bottom of the previous candle (liquidity sweep).
---
Alert function:
When the EMA(24) sweep conditions are met, the system will trigger an alert if you have set it up.
- Entry point: The closing price of the candle sweeping through EMA(24).
- Stop Loss:
- Buy Order: Place at the bottom of the sweep candle.
- Sell Order: Place at the top of the sweep candle.
---
Note:
This strategy is designed to help traders identify profitable trading opportunities based on trends. However, no strategy is 100% guaranteed to be successful. Please test it thoroughly on a demo account before using it.
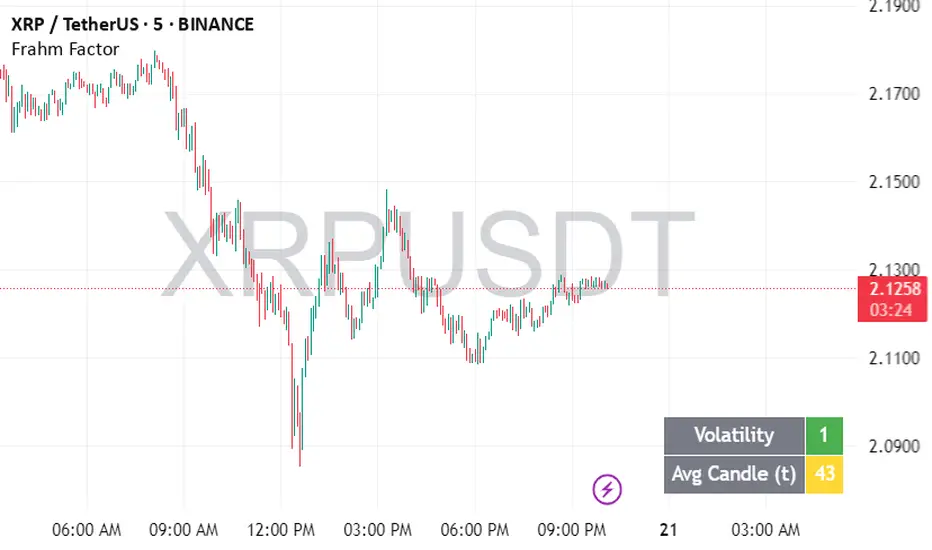
Frahm FactorIntended Usage of the Frahm Factor Indicator
The Frahm Factor is designed to give you a rapid, at-a-glance assessment of how volatile the market is right now—and how large the average candle has been—over the most recent 24-hour window. Here’s how to put it to work:
Gauge Volatility Regimes
Volatility Score (1–10)
A low score (1–3, green) signals calm seas—tight ranges, low risk of big moves.
A mid score (4–6, yellow) warns you that volatility is picking up.
A high score (7–10, red) tells you to prepare for disorderly swings or breakout opportunities.
How to trade off it
In low-volatility periods, you might favor mean-reversion or range-bound strategies.
As the score climbs into the red zone, consider widening stops, scaling back position size, or switching to breakout momentum plays.
Monitor Average Candle Size
Avg Candle (ticks) cell shows you the mean true-range of each bar over that 24h window in ticks.
When candles are small, you know the market is consolidating and liquidity may be thin.
When candles are large, momentum and volume are driving strong directional bias.
The optional dynamic color ramp (green→yellow→red) immediately flags when average bar size is unusually small or large versus its own 24h history.
Customize & Stay Flexible
Timeframes: Works on any intraday chart—from 1-minute scalping to 4-hour swing setups—because it always looks back exactly 24 hours.
Toggles:
Show or hide the Volatility and Avg-Candle cells to keep your screen uncluttered.
Turn on the dynamic color ramp only when you want that extra visual cue.
Alerts: Built-in alerts fire automatically at meaningful thresholds (Volatility ≥ 8 or ≤ 3), so you’ll never miss regime shifts, even if you step away.
Real-World Applications
Risk Management: Automatically adjust your stop-loss distances or position sizing based on the current volatility band.
Strategy Selection: Flip between range-trading and momentum strategies as the volatility regime changes.
Session Analysis: Pinpoint when during the day volatility typically ramps—perfect for doorway sessions like London opening or the US midday news spikes.
Bottom line: the Frahm Factor gives you one compact dashboard to see the pulse of the market—so you can make choices with conviction, dial your risk in real time, and never be caught off guard by sudden volatility shifts.
Logic Behind the Frahm Factor Indicator
24-Hour Rolling Window
On every intraday bar, we append that bar’s True Range (TR) and timestamp to two arrays.
We then prune any entries older than 24 hours, so the arrays always reflect exactly the last day of data.
Volatility Score (1–10)
We count how many of those 24 h TR values are less than or equal to the current bar’s TR.
Dividing by the total array size gives a percentile (0–1), which we scale and round into a 1–10 score.
Average Candle Size (ticks)
We sum all TR values in the same 24 h window, divide by array length to get the mean TR, then convert that price range into ticks.
Optionally, a green→yellow→red ramp highlights when average bar size is unusually small, medium or large versus its own 24 h history.
Color & Alerts
The Volatility cell flips green (1–3), yellow (4–6) or red (7–10) so you see regime shifts at a glance.
Built-in alertcondition calls fire when the score crosses your high (≥ 8) or low (≤ 3) thresholds.
Modularity
Everything—table location, which cells to show, dynamic coloring—is controlled by simple toggles, so you can strip it back or layer on extra visual cues as needed.
That’s the full recipe: a true 24 h look-back, a percentile-ranked volatility gauge, and a mean-bar-size meter, all wrapped into one compact dashboard.
PubLibCandleTrendLibrary "PubLibCandleTrend"
candle trend, multi-part candle trend, multi-part green/red candle trend, double candle trend and multi-part double candle trend conditions for indicator and strategy development
chh()
candle higher high condition
Returns: bool
chl()
candle higher low condition
Returns: bool
clh()
candle lower high condition
Returns: bool
cll()
candle lower low condition
Returns: bool
cdt()
candle double top condition
Returns: bool
cdb()
candle double bottom condition
Returns: bool
gc()
green candle condition
Returns: bool
gchh()
green candle higher high condition
Returns: bool
gchl()
green candle higher low condition
Returns: bool
gclh()
green candle lower high condition
Returns: bool
gcll()
green candle lower low condition
Returns: bool
gcdt()
green candle double top condition
Returns: bool
gcdb()
green candle double bottom condition
Returns: bool
rc()
red candle condition
Returns: bool
rchh()
red candle higher high condition
Returns: bool
rchl()
red candle higher low condition
Returns: bool
rclh()
red candle lower high condition
Returns: bool
rcll()
red candle lower low condition
Returns: bool
rcdt()
red candle double top condition
Returns: bool
rcdb()
red candle double bottom condition
Returns: bool
chh_1p()
1-part candle higher high condition
Returns: bool
chh_2p()
2-part candle higher high condition
Returns: bool
chh_3p()
3-part candle higher high condition
Returns: bool
chh_4p()
4-part candle higher high condition
Returns: bool
chh_5p()
5-part candle higher high condition
Returns: bool
chh_6p()
6-part candle higher high condition
Returns: bool
chh_7p()
7-part candle higher high condition
Returns: bool
chh_8p()
8-part candle higher high condition
Returns: bool
chh_9p()
9-part candle higher high condition
Returns: bool
chh_10p()
10-part candle higher high condition
Returns: bool
chh_11p()
11-part candle higher high condition
Returns: bool
chh_12p()
12-part candle higher high condition
Returns: bool
chh_13p()
13-part candle higher high condition
Returns: bool
chh_14p()
14-part candle higher high condition
Returns: bool
chh_15p()
15-part candle higher high condition
Returns: bool
chh_16p()
16-part candle higher high condition
Returns: bool
chh_17p()
17-part candle higher high condition
Returns: bool
chh_18p()
18-part candle higher high condition
Returns: bool
chh_19p()
19-part candle higher high condition
Returns: bool
chh_20p()
20-part candle higher high condition
Returns: bool
chh_21p()
21-part candle higher high condition
Returns: bool
chh_22p()
22-part candle higher high condition
Returns: bool
chh_23p()
23-part candle higher high condition
Returns: bool
chh_24p()
24-part candle higher high condition
Returns: bool
chh_25p()
25-part candle higher high condition
Returns: bool
chh_26p()
26-part candle higher high condition
Returns: bool
chh_27p()
27-part candle higher high condition
Returns: bool
chh_28p()
28-part candle higher high condition
Returns: bool
chh_29p()
29-part candle higher high condition
Returns: bool
chh_30p()
30-part candle higher high condition
Returns: bool
chl_1p()
1-part candle higher low condition
Returns: bool
chl_2p()
2-part candle higher low condition
Returns: bool
chl_3p()
3-part candle higher low condition
Returns: bool
chl_4p()
4-part candle higher low condition
Returns: bool
chl_5p()
5-part candle higher low condition
Returns: bool
chl_6p()
6-part candle higher low condition
Returns: bool
chl_7p()
7-part candle higher low condition
Returns: bool
chl_8p()
8-part candle higher low condition
Returns: bool
chl_9p()
9-part candle higher low condition
Returns: bool
chl_10p()
10-part candle higher low condition
Returns: bool
chl_11p()
11-part candle higher low condition
Returns: bool
chl_12p()
12-part candle higher low condition
Returns: bool
chl_13p()
13-part candle higher low condition
Returns: bool
chl_14p()
14-part candle higher low condition
Returns: bool
chl_15p()
15-part candle higher low condition
Returns: bool
chl_16p()
16-part candle higher low condition
Returns: bool
chl_17p()
17-part candle higher low condition
Returns: bool
chl_18p()
18-part candle higher low condition
Returns: bool
chl_19p()
19-part candle higher low condition
Returns: bool
chl_20p()
20-part candle higher low condition
Returns: bool
chl_21p()
21-part candle higher low condition
Returns: bool
chl_22p()
22-part candle higher low condition
Returns: bool
chl_23p()
23-part candle higher low condition
Returns: bool
chl_24p()
24-part candle higher low condition
Returns: bool
chl_25p()
25-part candle higher low condition
Returns: bool
chl_26p()
26-part candle higher low condition
Returns: bool
chl_27p()
27-part candle higher low condition
Returns: bool
chl_28p()
28-part candle higher low condition
Returns: bool
chl_29p()
29-part candle higher low condition
Returns: bool
chl_30p()
30-part candle higher low condition
Returns: bool
clh_1p()
1-part candle lower high condition
Returns: bool
clh_2p()
2-part candle lower high condition
Returns: bool
clh_3p()
3-part candle lower high condition
Returns: bool
clh_4p()
4-part candle lower high condition
Returns: bool
clh_5p()
5-part candle lower high condition
Returns: bool
clh_6p()
6-part candle lower high condition
Returns: bool
clh_7p()
7-part candle lower high condition
Returns: bool
clh_8p()
8-part candle lower high condition
Returns: bool
clh_9p()
9-part candle lower high condition
Returns: bool
clh_10p()
10-part candle lower high condition
Returns: bool
clh_11p()
11-part candle lower high condition
Returns: bool
clh_12p()
12-part candle lower high condition
Returns: bool
clh_13p()
13-part candle lower high condition
Returns: bool
clh_14p()
14-part candle lower high condition
Returns: bool
clh_15p()
15-part candle lower high condition
Returns: bool
clh_16p()
16-part candle lower high condition
Returns: bool
clh_17p()
17-part candle lower high condition
Returns: bool
clh_18p()
18-part candle lower high condition
Returns: bool
clh_19p()
19-part candle lower high condition
Returns: bool
clh_20p()
20-part candle lower high condition
Returns: bool
clh_21p()
21-part candle lower high condition
Returns: bool
clh_22p()
22-part candle lower high condition
Returns: bool
clh_23p()
23-part candle lower high condition
Returns: bool
clh_24p()
24-part candle lower high condition
Returns: bool
clh_25p()
25-part candle lower high condition
Returns: bool
clh_26p()
26-part candle lower high condition
Returns: bool
clh_27p()
27-part candle lower high condition
Returns: bool
clh_28p()
28-part candle lower high condition
Returns: bool
clh_29p()
29-part candle lower high condition
Returns: bool
clh_30p()
30-part candle lower high condition
Returns: bool
cll_1p()
1-part candle lower low condition
Returns: bool
cll_2p()
2-part candle lower low condition
Returns: bool
cll_3p()
3-part candle lower low condition
Returns: bool
cll_4p()
4-part candle lower low condition
Returns: bool
cll_5p()
5-part candle lower low condition
Returns: bool
cll_6p()
6-part candle lower low condition
Returns: bool
cll_7p()
7-part candle lower low condition
Returns: bool
cll_8p()
8-part candle lower low condition
Returns: bool
cll_9p()
9-part candle lower low condition
Returns: bool
cll_10p()
10-part candle lower low condition
Returns: bool
cll_11p()
11-part candle lower low condition
Returns: bool
cll_12p()
12-part candle lower low condition
Returns: bool
cll_13p()
13-part candle lower low condition
Returns: bool
cll_14p()
14-part candle lower low condition
Returns: bool
cll_15p()
15-part candle lower low condition
Returns: bool
cll_16p()
16-part candle lower low condition
Returns: bool
cll_17p()
17-part candle lower low condition
Returns: bool
cll_18p()
18-part candle lower low condition
Returns: bool
cll_19p()
19-part candle lower low condition
Returns: bool
cll_20p()
20-part candle lower low condition
Returns: bool
cll_21p()
21-part candle lower low condition
Returns: bool
cll_22p()
22-part candle lower low condition
Returns: bool
cll_23p()
23-part candle lower low condition
Returns: bool
cll_24p()
24-part candle lower low condition
Returns: bool
cll_25p()
25-part candle lower low condition
Returns: bool
cll_26p()
26-part candle lower low condition
Returns: bool
cll_27p()
27-part candle lower low condition
Returns: bool
cll_28p()
28-part candle lower low condition
Returns: bool
cll_29p()
29-part candle lower low condition
Returns: bool
cll_30p()
30-part candle lower low condition
Returns: bool
gc_1p()
1-part green candle condition
Returns: bool
gc_2p()
2-part green candle condition
Returns: bool
gc_3p()
3-part green candle condition
Returns: bool
gc_4p()
4-part green candle condition
Returns: bool
gc_5p()
5-part green candle condition
Returns: bool
gc_6p()
6-part green candle condition
Returns: bool
gc_7p()
7-part green candle condition
Returns: bool
gc_8p()
8-part green candle condition
Returns: bool
gc_9p()
9-part green candle condition
Returns: bool
gc_10p()
10-part green candle condition
Returns: bool
gc_11p()
11-part green candle condition
Returns: bool
gc_12p()
12-part green candle condition
Returns: bool
gc_13p()
13-part green candle condition
Returns: bool
gc_14p()
14-part green candle condition
Returns: bool
gc_15p()
15-part green candle condition
Returns: bool
gc_16p()
16-part green candle condition
Returns: bool
gc_17p()
17-part green candle condition
Returns: bool
gc_18p()
18-part green candle condition
Returns: bool
gc_19p()
19-part green candle condition
Returns: bool
gc_20p()
20-part green candle condition
Returns: bool
gc_21p()
21-part green candle condition
Returns: bool
gc_22p()
22-part green candle condition
Returns: bool
gc_23p()
23-part green candle condition
Returns: bool
gc_24p()
24-part green candle condition
Returns: bool
gc_25p()
25-part green candle condition
Returns: bool
gc_26p()
26-part green candle condition
Returns: bool
gc_27p()
27-part green candle condition
Returns: bool
gc_28p()
28-part green candle condition
Returns: bool
gc_29p()
29-part green candle condition
Returns: bool
gc_30p()
30-part green candle condition
Returns: bool
rc_1p()
1-part red candle condition
Returns: bool
rc_2p()
2-part red candle condition
Returns: bool
rc_3p()
3-part red candle condition
Returns: bool
rc_4p()
4-part red candle condition
Returns: bool
rc_5p()
5-part red candle condition
Returns: bool
rc_6p()
6-part red candle condition
Returns: bool
rc_7p()
7-part red candle condition
Returns: bool
rc_8p()
8-part red candle condition
Returns: bool
rc_9p()
9-part red candle condition
Returns: bool
rc_10p()
10-part red candle condition
Returns: bool
rc_11p()
11-part red candle condition
Returns: bool
rc_12p()
12-part red candle condition
Returns: bool
rc_13p()
13-part red candle condition
Returns: bool
rc_14p()
14-part red candle condition
Returns: bool
rc_15p()
15-part red candle condition
Returns: bool
rc_16p()
16-part red candle condition
Returns: bool
rc_17p()
17-part red candle condition
Returns: bool
rc_18p()
18-part red candle condition
Returns: bool
rc_19p()
19-part red candle condition
Returns: bool
rc_20p()
20-part red candle condition
Returns: bool
rc_21p()
21-part red candle condition
Returns: bool
rc_22p()
22-part red candle condition
Returns: bool
rc_23p()
23-part red candle condition
Returns: bool
rc_24p()
24-part red candle condition
Returns: bool
rc_25p()
25-part red candle condition
Returns: bool
rc_26p()
26-part red candle condition
Returns: bool
rc_27p()
27-part red candle condition
Returns: bool
rc_28p()
28-part red candle condition
Returns: bool
rc_29p()
29-part red candle condition
Returns: bool
rc_30p()
30-part red candle condition
Returns: bool
cdut()
candle double uptrend condition
Returns: bool
cddt()
candle double downtrend condition
Returns: bool
cdut_1p()
1-part candle double uptrend condition
Returns: bool
cdut_2p()
2-part candle double uptrend condition
Returns: bool
cdut_3p()
3-part candle double uptrend condition
Returns: bool
cdut_4p()
4-part candle double uptrend condition
Returns: bool
cdut_5p()
5-part candle double uptrend condition
Returns: bool
cdut_6p()
6-part candle double uptrend condition
Returns: bool
cdut_7p()
7-part candle double uptrend condition
Returns: bool
cdut_8p()
8-part candle double uptrend condition
Returns: bool
cdut_9p()
9-part candle double uptrend condition
Returns: bool
cdut_10p()
10-part candle double uptrend condition
Returns: bool
cdut_11p()
11-part candle double uptrend condition
Returns: bool
cdut_12p()
12-part candle double uptrend condition
Returns: bool
cdut_13p()
13-part candle double uptrend condition
Returns: bool
cdut_14p()
14-part candle double uptrend condition
Returns: bool
cdut_15p()
15-part candle double uptrend condition
Returns: bool
cdut_16p()
16-part candle double uptrend condition
Returns: bool
cdut_17p()
17-part candle double uptrend condition
Returns: bool
cdut_18p()
18-part candle double uptrend condition
Returns: bool
cdut_19p()
19-part candle double uptrend condition
Returns: bool
cdut_20p()
20-part candle double uptrend condition
Returns: bool
cdut_21p()
21-part candle double uptrend condition
Returns: bool
cdut_22p()
22-part candle double uptrend condition
Returns: bool
cdut_23p()
23-part candle double uptrend condition
Returns: bool
cdut_24p()
24-part candle double uptrend condition
Returns: bool
cdut_25p()
25-part candle double uptrend condition
Returns: bool
cdut_26p()
26-part candle double uptrend condition
Returns: bool
cdut_27p()
27-part candle double uptrend condition
Returns: bool
cdut_28p()
28-part candle double uptrend condition
Returns: bool
cdut_29p()
29-part candle double uptrend condition
Returns: bool
cdut_30p()
30-part candle double uptrend condition
Returns: bool
cddt_1p()
1-part candle double downtrend condition
Returns: bool
cddt_2p()
2-part candle double downtrend condition
Returns: bool
cddt_3p()
3-part candle double downtrend condition
Returns: bool
cddt_4p()
4-part candle double downtrend condition
Returns: bool
cddt_5p()
5-part candle double downtrend condition
Returns: bool
cddt_6p()
6-part candle double downtrend condition
Returns: bool
cddt_7p()
7-part candle double downtrend condition
Returns: bool
cddt_8p()
8-part candle double downtrend condition
Returns: bool
cddt_9p()
9-part candle double downtrend condition
Returns: bool
cddt_10p()
10-part candle double downtrend condition
Returns: bool
cddt_11p()
11-part candle double downtrend condition
Returns: bool
cddt_12p()
12-part candle double downtrend condition
Returns: bool
cddt_13p()
13-part candle double downtrend condition
Returns: bool
cddt_14p()
14-part candle double downtrend condition
Returns: bool
cddt_15p()
15-part candle double downtrend condition
Returns: bool
cddt_16p()
16-part candle double downtrend condition
Returns: bool
cddt_17p()
17-part candle double downtrend condition
Returns: bool
cddt_18p()
18-part candle double downtrend condition
Returns: bool
cddt_19p()
19-part candle double downtrend condition
Returns: bool
cddt_20p()
20-part candle double downtrend condition
Returns: bool
cddt_21p()
21-part candle double downtrend condition
Returns: bool
cddt_22p()
22-part candle double downtrend condition
Returns: bool
cddt_23p()
23-part candle double downtrend condition
Returns: bool
cddt_24p()
24-part candle double downtrend condition
Returns: bool
cddt_25p()
25-part candle double downtrend condition
Returns: bool
cddt_26p()
26-part candle double downtrend condition
Returns: bool
cddt_27p()
27-part candle double downtrend condition
Returns: bool
cddt_28p()
28-part candle double downtrend condition
Returns: bool
cddt_29p()
29-part candle double downtrend condition
Returns: bool
cddt_30p()
30-part candle double downtrend condition
Returns: bool

TeeLek-BestPositionThis indicator is used to indicate the best buying and selling points.
This indicator will calculate the best buying points (blue) and selling points (orange). The working principle is that the blue point is the point where the RSI is Over Sold, the orange point is the point where the RSI is Over Bought. After that, we will use the Highest Line 100 and Lowest Line 100 to filter the points another layer. And because when Over Bought/Over Sold occurs, there will be continuous signals that are repeated, causing confusion. Therefore, there is a feature to leave a time frame. Set the default value to 24 hours. If a signal occurs, it will be left out.
The appropriate point for buying is:
The point where Over Sold occurs and Closes lower than the Lowest Line 100.
Leave a time frame for 24 hours before a new signal occurs.
The appropriate point for selling is:
The point where Over Bought occurs and Closes higher than the Highest Line 100.
Leave a time frame for 24 hours before a new signal occurs.
It helps us to gradually buy and collect/sell for profit easily without confusion.
อินดิเคเตอร์นี้ใช้ สำหรับบอกจุดซื้อจุดขายที่ดีที่สุด
อินดิเคเตอร์นี้ จะคำนวณจุดซื้อ (สีฟ้า) และจุดขาย (สีส้ม) ที่ดีที่สุดมาให้ โดยหลักการทำงาน คือ จุดสีฟ้า คือจุดที่ RSI Over Sold จุดสีส้ม คือจุดที่ RSI Over Bought หลังจากนั้นเราจะใช้เส้น Highest Line 100 และ Lowest Line 100 เพื่อกรองจุดอีกชั้นหนึ่ง และเนื่องจากเมื่อเกิด Over Bought/Over Sold แล้ว มันจะเกิดสัญญาณต่อเนื่องซ้ำๆ ทำให้สับสน จึงได้มีฟีเจอร์ในการเว้นระยะเวลา ตั้งค่าไว้เริ่มต้นที่ 24 ชั่วโมง ถ้าเกิดสัญญาณแล้วก็จะเว้นระยะออกไป
จุดที่เหมาะสมกับการซื้อ คือ
จุดที่เกิด Over Sold และ Close ต่ำกว่าเส้น Lowest Line 100
เว้นระยะไป 24 ชั่วโมงจึงจะเกิดสัญญาณใหม่อีกครั้ง
จุดที่เหมาะสมกับการขาย คือ
จุดที่เกิด Over Bought และ Close สูงกว่าเส้น Highest Line 100
เว้นระยะไป 24 ชั่วโมงจึงจะเกิดสัญญาณใหม่อีกครั้ง
ช่วยให้เราสามารถ ทยอยซื้อเก็บสะสม/ทยอยขายทำกำไร ได้ง่ายไม่สับสน

PubLibTrendLibrary "PubLibTrend"
trend, multi-part trend, double trend and multi-part double trend conditions for indicator and strategy development
rlut()
return line uptrend condition
Returns: bool
dt()
downtrend condition
Returns: bool
ut()
uptrend condition
Returns: bool
rldt()
return line downtrend condition
Returns: bool
dtop()
double top condition
Returns: bool
dbot()
double bottom condition
Returns: bool
rlut_1p()
1-part return line uptrend condition
Returns: bool
rlut_2p()
2-part return line uptrend condition
Returns: bool
rlut_3p()
3-part return line uptrend condition
Returns: bool
rlut_4p()
4-part return line uptrend condition
Returns: bool
rlut_5p()
5-part return line uptrend condition
Returns: bool
rlut_6p()
6-part return line uptrend condition
Returns: bool
rlut_7p()
7-part return line uptrend condition
Returns: bool
rlut_8p()
8-part return line uptrend condition
Returns: bool
rlut_9p()
9-part return line uptrend condition
Returns: bool
rlut_10p()
10-part return line uptrend condition
Returns: bool
rlut_11p()
11-part return line uptrend condition
Returns: bool
rlut_12p()
12-part return line uptrend condition
Returns: bool
rlut_13p()
13-part return line uptrend condition
Returns: bool
rlut_14p()
14-part return line uptrend condition
Returns: bool
rlut_15p()
15-part return line uptrend condition
Returns: bool
rlut_16p()
16-part return line uptrend condition
Returns: bool
rlut_17p()
17-part return line uptrend condition
Returns: bool
rlut_18p()
18-part return line uptrend condition
Returns: bool
rlut_19p()
19-part return line uptrend condition
Returns: bool
rlut_20p()
20-part return line uptrend condition
Returns: bool
rlut_21p()
21-part return line uptrend condition
Returns: bool
rlut_22p()
22-part return line uptrend condition
Returns: bool
rlut_23p()
23-part return line uptrend condition
Returns: bool
rlut_24p()
24-part return line uptrend condition
Returns: bool
rlut_25p()
25-part return line uptrend condition
Returns: bool
rlut_26p()
26-part return line uptrend condition
Returns: bool
rlut_27p()
27-part return line uptrend condition
Returns: bool
rlut_28p()
28-part return line uptrend condition
Returns: bool
rlut_29p()
29-part return line uptrend condition
Returns: bool
rlut_30p()
30-part return line uptrend condition
Returns: bool
dt_1p()
1-part downtrend condition
Returns: bool
dt_2p()
2-part downtrend condition
Returns: bool
dt_3p()
3-part downtrend condition
Returns: bool
dt_4p()
4-part downtrend condition
Returns: bool
dt_5p()
5-part downtrend condition
Returns: bool
dt_6p()
6-part downtrend condition
Returns: bool
dt_7p()
7-part downtrend condition
Returns: bool
dt_8p()
8-part downtrend condition
Returns: bool
dt_9p()
9-part downtrend condition
Returns: bool
dt_10p()
10-part downtrend condition
Returns: bool
dt_11p()
11-part downtrend condition
Returns: bool
dt_12p()
12-part downtrend condition
Returns: bool
dt_13p()
13-part downtrend condition
Returns: bool
dt_14p()
14-part downtrend condition
Returns: bool
dt_15p()
15-part downtrend condition
Returns: bool
dt_16p()
16-part downtrend condition
Returns: bool
dt_17p()
17-part downtrend condition
Returns: bool
dt_18p()
18-part downtrend condition
Returns: bool
dt_19p()
19-part downtrend condition
Returns: bool
dt_20p()
20-part downtrend condition
Returns: bool
dt_21p()
21-part downtrend condition
Returns: bool
dt_22p()
22-part downtrend condition
Returns: bool
dt_23p()
23-part downtrend condition
Returns: bool
dt_24p()
24-part downtrend condition
Returns: bool
dt_25p()
25-part downtrend condition
Returns: bool
dt_26p()
26-part downtrend condition
Returns: bool
dt_27p()
27-part downtrend condition
Returns: bool
dt_28p()
28-part downtrend condition
Returns: bool
dt_29p()
29-part downtrend condition
Returns: bool
dt_30p()
30-part downtrend condition
Returns: bool
ut_1p()
1-part uptrend condition
Returns: bool
ut_2p()
2-part uptrend condition
Returns: bool
ut_3p()
3-part uptrend condition
Returns: bool
ut_4p()
4-part uptrend condition
Returns: bool
ut_5p()
5-part uptrend condition
Returns: bool
ut_6p()
6-part uptrend condition
Returns: bool
ut_7p()
7-part uptrend condition
Returns: bool
ut_8p()
8-part uptrend condition
Returns: bool
ut_9p()
9-part uptrend condition
Returns: bool
ut_10p()
10-part uptrend condition
Returns: bool
ut_11p()
11-part uptrend condition
Returns: bool
ut_12p()
12-part uptrend condition
Returns: bool
ut_13p()
13-part uptrend condition
Returns: bool
ut_14p()
14-part uptrend condition
Returns: bool
ut_15p()
15-part uptrend condition
Returns: bool
ut_16p()
16-part uptrend condition
Returns: bool
ut_17p()
17-part uptrend condition
Returns: bool
ut_18p()
18-part uptrend condition
Returns: bool
ut_19p()
19-part uptrend condition
Returns: bool
ut_20p()
20-part uptrend condition
Returns: bool
ut_21p()
21-part uptrend condition
Returns: bool
ut_22p()
22-part uptrend condition
Returns: bool
ut_23p()
23-part uptrend condition
Returns: bool
ut_24p()
24-part uptrend condition
Returns: bool
ut_25p()
25-part uptrend condition
Returns: bool
ut_26p()
26-part uptrend condition
Returns: bool
ut_27p()
27-part uptrend condition
Returns: bool
ut_28p()
28-part uptrend condition
Returns: bool
ut_29p()
29-part uptrend condition
Returns: bool
ut_30p()
30-part uptrend condition
Returns: bool
rldt_1p()
1-part return line downtrend condition
Returns: bool
rldt_2p()
2-part return line downtrend condition
Returns: bool
rldt_3p()
3-part return line downtrend condition
Returns: bool
rldt_4p()
4-part return line downtrend condition
Returns: bool
rldt_5p()
5-part return line downtrend condition
Returns: bool
rldt_6p()
6-part return line downtrend condition
Returns: bool
rldt_7p()
7-part return line downtrend condition
Returns: bool
rldt_8p()
8-part return line downtrend condition
Returns: bool
rldt_9p()
9-part return line downtrend condition
Returns: bool
rldt_10p()
10-part return line downtrend condition
Returns: bool
rldt_11p()
11-part return line downtrend condition
Returns: bool
rldt_12p()
12-part return line downtrend condition
Returns: bool
rldt_13p()
13-part return line downtrend condition
Returns: bool
rldt_14p()
14-part return line downtrend condition
Returns: bool
rldt_15p()
15-part return line downtrend condition
Returns: bool
rldt_16p()
16-part return line downtrend condition
Returns: bool
rldt_17p()
17-part return line downtrend condition
Returns: bool
rldt_18p()
18-part return line downtrend condition
Returns: bool
rldt_19p()
19-part return line downtrend condition
Returns: bool
rldt_20p()
20-part return line downtrend condition
Returns: bool
rldt_21p()
21-part return line downtrend condition
Returns: bool
rldt_22p()
22-part return line downtrend condition
Returns: bool
rldt_23p()
23-part return line downtrend condition
Returns: bool
rldt_24p()
24-part return line downtrend condition
Returns: bool
rldt_25p()
25-part return line downtrend condition
Returns: bool
rldt_26p()
26-part return line downtrend condition
Returns: bool
rldt_27p()
27-part return line downtrend condition
Returns: bool
rldt_28p()
28-part return line downtrend condition
Returns: bool
rldt_29p()
29-part return line downtrend condition
Returns: bool
rldt_30p()
30-part return line downtrend condition
Returns: bool
dut()
double uptrend condition
Returns: bool
ddt()
double downtrend condition
Returns: bool
dut_1p()
1-part double uptrend condition
Returns: bool
dut_2p()
2-part double uptrend condition
Returns: bool
dut_3p()
3-part double uptrend condition
Returns: bool
dut_4p()
4-part double uptrend condition
Returns: bool
dut_5p()
5-part double uptrend condition
Returns: bool
dut_6p()
6-part double uptrend condition
Returns: bool
dut_7p()
7-part double uptrend condition
Returns: bool
dut_8p()
8-part double uptrend condition
Returns: bool
dut_9p()
9-part double uptrend condition
Returns: bool
dut_10p()
10-part double uptrend condition
Returns: bool
dut_11p()
11-part double uptrend condition
Returns: bool
dut_12p()
12-part double uptrend condition
Returns: bool
dut_13p()
13-part double uptrend condition
Returns: bool
dut_14p()
14-part double uptrend condition
Returns: bool
dut_15p()
15-part double uptrend condition
Returns: bool
dut_16p()
16-part double uptrend condition
Returns: bool
dut_17p()
17-part double uptrend condition
Returns: bool
dut_18p()
18-part double uptrend condition
Returns: bool
dut_19p()
19-part double uptrend condition
Returns: bool
dut_20p()
20-part double uptrend condition
Returns: bool
dut_21p()
21-part double uptrend condition
Returns: bool
dut_22p()
22-part double uptrend condition
Returns: bool
dut_23p()
23-part double uptrend condition
Returns: bool
dut_24p()
24-part double uptrend condition
Returns: bool
dut_25p()
25-part double uptrend condition
Returns: bool
dut_26p()
26-part double uptrend condition
Returns: bool
dut_27p()
27-part double uptrend condition
Returns: bool
dut_28p()
28-part double uptrend condition
Returns: bool
dut_29p()
29-part double uptrend condition
Returns: bool
dut_30p()
30-part double uptrend condition
Returns: bool
ddt_1p()
1-part double downtrend condition
Returns: bool
ddt_2p()
2-part double downtrend condition
Returns: bool
ddt_3p()
3-part double downtrend condition
Returns: bool
ddt_4p()
4-part double downtrend condition
Returns: bool
ddt_5p()
5-part double downtrend condition
Returns: bool
ddt_6p()
6-part double downtrend condition
Returns: bool
ddt_7p()
7-part double downtrend condition
Returns: bool
ddt_8p()
8-part double downtrend condition
Returns: bool
ddt_9p()
9-part double downtrend condition
Returns: bool
ddt_10p()
10-part double downtrend condition
Returns: bool
ddt_11p()
11-part double downtrend condition
Returns: bool
ddt_12p()
12-part double downtrend condition
Returns: bool
ddt_13p()
13-part double downtrend condition
Returns: bool
ddt_14p()
14-part double downtrend condition
Returns: bool
ddt_15p()
15-part double downtrend condition
Returns: bool
ddt_16p()
16-part double downtrend condition
Returns: bool
ddt_17p()
17-part double downtrend condition
Returns: bool
ddt_18p()
18-part double downtrend condition
Returns: bool
ddt_19p()
19-part double downtrend condition
Returns: bool
ddt_20p()
20-part double downtrend condition
Returns: bool
ddt_21p()
21-part double downtrend condition
Returns: bool
ddt_22p()
22-part double downtrend condition
Returns: bool
ddt_23p()
23-part double downtrend condition
Returns: bool
ddt_24p()
24-part double downtrend condition
Returns: bool
ddt_25p()
25-part double downtrend condition
Returns: bool
ddt_26p()
26-part double downtrend condition
Returns: bool
ddt_27p()
27-part double downtrend condition
Returns: bool
ddt_28p()
28-part double downtrend condition
Returns: bool
ddt_29p()
29-part double downtrend condition
Returns: bool
ddt_30p()
30-part double downtrend condition
Returns: bool

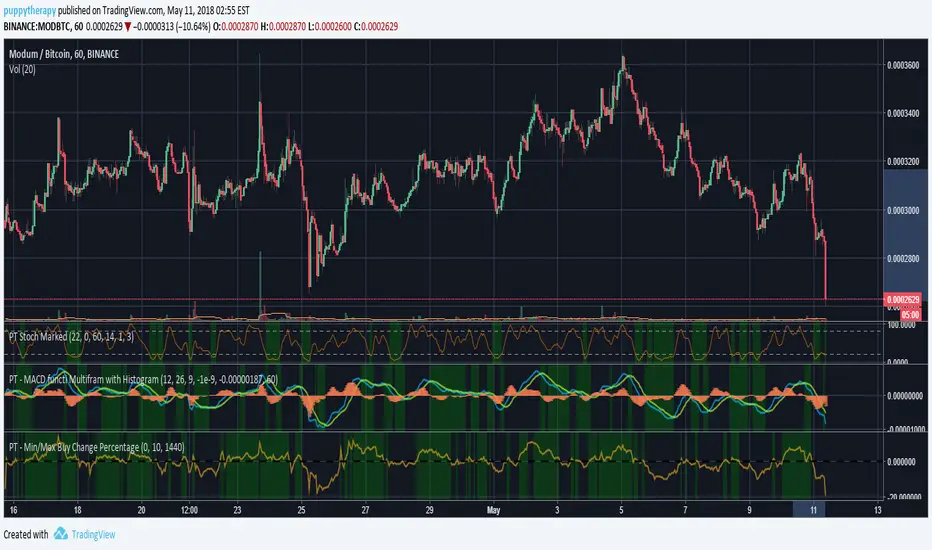
PT - Min/Max Buy Change PercentageDEFAULT_buy_min_change_percentage
Only purchase a coin if the 24 hour percentage change is above the set value.
Example:
DEFAULT_buy_min_change_percentage = 3.5 –> Only buy a coin if the 24 hour change is above 3.5%
DEFAULT_buy_min_change_percentage = -2 –> Only buy a coin if the 24 hour change is above -2%
DEFAULT_buy_max_change_percentage
Only purchase a coin if the 24 hour percentage change is below the set value.
Example:
DEFAULT_buy_max_change_percentage = 8 –> Only buy a coin if the 24 hour change is below 8%
DEFAULT_buy_max_change_percentage = -1 –> Only buy a coin if the 24 hour change is below -1%
Source Profit Trailer Wiki ( wiki.profittrailer.com )
Range Bar Gaps DetectorRange Bar Gaps Detector
Overview
The Range Bar Gaps Detector identifies price gaps across multiple range bar sizes (12, 24, 60, and 120) on any trading instrument, helping traders spot potential support/resistance zones or breakout opportunities. Designed for Pine Script v6, this indicator detects gaps on range bars and exports data for use in companion scripts like Range Bar Gaps Overlap, making it ideal for multi-timeframe gap analysis.
Key Features
Multi-Range Gap Detection: Identifies gaps on 12, 24, 60, and 120-range bars, capturing both bullish (gap up) and bearish (gap down) price movements.
Customizable Sensitivity: Includes a user-defined minimum deviation (default: 10% of 14-period SMA) for 12-range gaps to filter out noise.
7-Day Lookback: Automatically prunes gaps older than 7 days to focus on recent, relevant price levels.
Data Export: Serializes up to 10 gaps per range (tops, bottoms, start bars, highest/lowest prices, and age) for seamless integration with overlap analysis scripts.
Debugging Support: Plots gap counts and aggregation data in the Data Window for easy verification of detected gaps.
How It Works
The indicator aggregates price movements to simulate higher range bars (24, 60, 120) from a base range bar chart. It detects gaps when the price jumps significantly between bars, ensuring gaps meet the minimum deviation threshold for 12-range bars. Gaps are stored in arrays, serialized for external use, and pruned after 7 days to maintain efficiency.
Usage
Add to your range bar chart (e.g., 12-range) to detect gaps across multiple ranges.
Use alongside the Range Bar Gaps Overlap indicator to visualize gaps and their overlaps as boxes on the chart.
Check the Data Window to confirm gap counts and sizes for each range (12, 24, 60, 120).
Adjust the "Minimal Deviation (%) for 12-Range" input to control gap detection sensitivity.
Settings
Minimal Deviation (%) for 12-Range: Set the minimum gap size for 12-range bars (default: 10% of 14-period SMA).
Range Sizes: Fixed at 24, 60, and 120 for higher range bar aggregation.
Notes
Ensure the script is published under your TradingView username (e.g., GreenArrow2005) for use with companion scripts.
Best used on range bar charts to maintain consistent gap detection.
For advanced overlap analysis, pair with the Range Bar Gaps Overlap indicator to highlight zones where gaps from different ranges align.
Ideal For
Traders seeking to identify key price levels for support/resistance or breakout strategies.
Multi-timeframe analysts combining gap data across various range bar sizes.
Developers building custom indicators that leverage gap data for advanced charting.

Ragi's 24h volumeThis script is a TradingView Pine Script indicator that displays the 24-hour trading volume for a given asset. It provides both the native volume of the asset and, if the asset is not already listed on Binance, also displays the 24-hour volume from Binance (if applicable). Here's a breakdown of the key components:
Volume Calculation:
It sums the volume data over different time frames: 1-minute, 5-minute (for daily charts), or 60-minute intervals.
The volume is calculated based on the asset's volume type (either "quote" volume or a calculated value of close * volume).
For crypto assets, if the volume data is unavailable, it raises an error.
Binance Volume:
If the asset is not from Binance, the script fetches 24-hour volume data from Binance for that symbol, ensuring it is using the correct currency rate.
Display:
The indicator displays a table with the 24-hour volume in the chosen position on the chart (top, middle, or bottom).
The table displays the current exchange's volume, and if applicable, the Binance volume.
The volume is color-coded based on predefined thresholds:
Attention: Displays a warning color for volumes exceeding the attention level.
Warning: Shows an alert color for volumes above the warning threshold.
Normal: Displays in standard color when the volume is lower than the warning level.
The text and background color are customizable, and users can adjust the text size and position of the table.
User Inputs:
The script allows customization of table text size, position, background color, and volume thresholds for attention and warning.
In summary, this indicator is designed to track and display 24-hour volume on a chart, with additional volume information from Binance if necessary, and provides visual cues based on volume levels to help traders quickly assess trading activity.
Timeframe-Based Dynamic MA [odnac]
This code is a Timeframe-Based Dynamic MA indicator, written in Pine Script, that dynamically calculates and displays the Simple Moving Average (SMA), Exponential Moving Average (EMA), and Volume Weighted Moving Average (VWMA) based on a 24-hour period, according to the selected timeframe. It automatically adjusts the length of the moving averages for each timeframe, showing the appropriate value optimized for that specific timeframe.
Code Explanation:
Settings:
inputLength: A user input that allows setting the base time (24 hours by default). This value determines the reference for calculating the length of the moving averages according to the timeframe.
transp: A setting for the transparency of the moving average lines. It can accept values from 0 to 100 (0 is opaque, 100 is fully transparent).
Timeframe-Based Moving Average Calculation:
The length variable is dynamically calculated based on the current chart's timeframe.
For shorter timeframes like 1-minute, 2-minute, 3-minute, 5-minute, 10-minute, 15-minute, 30-minute, and 45-minute, the length is calculated by multiplying 60 / selected timeframe to obtain the moving average length based on a 24-hour period.
For longer timeframes like 1 hour, 4 hours, and 1 day, fixed values are used to set the moving average length.
Moving Average Calculation:
sma, ema, vwma: These are the Simple Moving Average, Exponential Moving Average, and Volume Weighted Moving Average calculated based on the length.
else_sma, else_ema, else_vwma: These represent the moving averages fetched from the 1-hour chart. For timeframes that are not calculated directly, the values are taken from the 1-hour chart.
Displaying the Moving Averages:
The moving averages are plotted according to the length calculated for the current timeframe.
If the length for the current timeframe is valid, the corresponding SMA, EMA, and VWMA values are displayed. Otherwise, the values fetched from the 1-hour chart are used.
The moving averages are displayed with the transparency (transp) value set by the user, controlling their opacity on the chart.
How to Use:
Base Time: The user sets a base time. For example, setting inputLength to 24 will calculate the moving average length based on a 24-hour period, which will be dynamically adjusted and displayed according to the selected timeframe.
Transparency Setting: The transparency of the moving average lines can be adjusted using the transp value.
Supported Timeframes:
For shorter timeframes (1-minute, 2-minute, 3-minute, 5-minute, 10-minute, 15-minute, 30-minute, 45-minute), the moving average lengths are dynamically calculated and displayed.
For longer timeframes (1 hour, 4 hours, 1 day), fixed length values are used.
This indicator allows you to dynamically calculate daily moving averages across different timeframes and visually check which moving average is the most appropriate for the selected timeframe.

Ichimoku Kinko Hyo + HULL-MA_X + MacDThe Ichimoku Kinko Hyo system includes five kinds of signal, of which this strategy uses the most recent of ones i.e. Tenkan Sen / Kijun Sen Cross and price crosses the Kijun Sen. As the Chikou Span, Senkou Span A and Senkou Span B are shifted into the past/future, the trigger signals will be only be used for visual confirmation and not part of the strategy.
The Tenkan Sen, also known as the Turning or Conversion line, is a moving average of the highest high and lowest low over the last 9 periods in this strategy.
The Kijun Sen, also known as the Standard or Base line, is a moving average of the highest high and lowest low over the last 24 periods in this strategy.
The Chikou Span, also known as the Lagging line, is the closing price plotted 24 periods behind in this strategy.
The Senkou Span A, also known as the 1st leading line, is a moving average of the Tenkan Sen and Kijun Sen and is plotted 24 periods ahead in this strategy.
The Senkou Span B, also known as the 2nd leading line, is a moving average of the highest high and lowest low over the last 51 trading days is plotted 24 periods ahead in this strategy.
Moving average convergence divergence (MaCD) is a trend-following momentum indicator that shows the relationship between two moving averages of prices. The MaCD is calculated in this strategy by subtracting the 24-day exponential moving average (EMA) from the 12-day EMA. A nine-day EMA of the MACD, called the "signal line", aMaCD in this case, is then plotted on top of the MaCD. In this strategy, MaCD/ aMaCD Cross is functioning as a trigger for buy and sell signals.
As with most technical analysis methods, Ichimoku is likely to produce frequent conflicting signals in non-trending markets, So in addition to Ichimoku Kinko Hyo, the Hull MA is popular amongst some day traders, as the indicator which in combination with MaCD attempts to give an accurate signal by eliminating lags and improving the smoothness of the line.
Alan Hull, developed this moving average indicator and hence it’s called the Hull MA.
Now, let’s dissect how the Hull moving average is calculated.
The Hull MA involves the weighted moving average (WMA) in its calculation.
First, calculate the WMA with period (n / 2) and multiply this by 2. Remember ‘n’ is the time period configurable based on the trader’s requirement. The default setting is 12 periods in this strategy, fast Hull MA crossing slow Hull MA will generate a circle on charts.
Second, calculate the WMA for period “n” and subtract if from the first step. Thirdly, calculate the weighted moving average with period sqrt (n) using the data from the second step. You can take a look at the below formula:
Hull MA= WMA (2*WMA (n/2) − WMA (n)), sqrt (n))
The Hull MA Cross in combination with Tenkan Sen / Kijun Sen Cross and MaCD tries to give an accurate signal by eliminating lags and improve the smoothness of price activity. Please note that price trends can and do change often, so your readings of the charts and this trading system should be probabilistic, rather than predictive.
