Support/Resistance LevelsThis indicator automatically detects the most relevant support and resistance levels based on recent pivot points.
Main Features:
✅ Automatic detection of support and resistance zones
✅ Fully customizable: line style, thickness, and colors
✅ Optional support/resistance zones (based on percentage)
✅ High/Low zone fill for recent extremes
✅ Auto-labeling of S/R levels on the chart
✅ Configurable line extension (right side only or both sides)
⚙️ Custom Settings:
Toggle S/R levels on or off
Choose line style (solid, dotted, dashed)
Set support/resistance colors
Adjust line width
Enable/disable zone display
Set zone width as a percentage
🔎 Use Cases:
Quickly identify key price levels
Trade with confidence around bounces and breakouts
Works on any market and any timeframe
Göstergeler ve stratejiler

berkusa Weekend and Daily virtual gapThe gap formed during weekends and weekdays on the CME exchange is virtually created because it does not occur on exchanges like Binance, which operate 24/7.
You need to use on crypto exchanges like Binance etc, which operate 24/7.
Weekend and Daily virtualgap Indicator and CME Gap UsageIndicator Overview
This Pine Script indicator visualizes weekend and daily trading sessions on the Bitcoin CME Futures chart, serving as a powerful tool for analyzing CME gaps. The Chicago Mercantile Exchange (CME) operates with limited trading hours (Sunday 18:00 to Friday 17:00, with a daily 1-hour break from 17:00 to 18:00, New York time), unlike the 24/7 spot Bitcoin market. This mismatch creates "gaps" on the CME chart during weekend closures, which this indicator helps identify and analyze alongside session ranges.Key Features Weekend Session (Friday 17:00 - Sunday 18:00): Starts at Friday 17:00 and ends at Sunday 18:00 (New York time).
Box extends to the next Friday 17:00 (yellow, customizable).
Session name and price range (e.g., "WEEKEND 2025-07-18 (123.45)") displayed in the top-right corner (size.tiny).
Historical sessions: Default 3 weeks (weeksBack).
Midpoint line: Drawn at the session’s high-low midpoint, cyan (#00fffb).
Daily Session (17:00-18:00): Runs daily from 17:00 to 18:00 (New York time, excluding weekends).
Box extends to the next day’s 17:00 (blue, customizable).
Session name and price range in the top-right corner (size.tiny).
Historical sessions: Default 7 days (dailySessionsBack).
Midpoint line: Red (#FF0000).
Open Lines: Friday 17:00 or Sunday 18:00 Open Line: User selects “Friday” or “Sunday” (fridayOrSunday). Friday: Open price line extends to the next Friday 17:00.
Sunday: Open price line extends to the same day’s Sunday 18:00 (end of weekend session).
Line count: Default 2 (maxFridayLines), orange (fridayOpenColor).
Daily 18:00 Open Line: Daily 18:00 open price (excluding weekends), extends to the next day’s 18:00 (green, maxDailyLines=2).
Customization: Show/hide options: Weekend sessions (showWeekend), daily sessions (showDaily), open lines (showFridayOpenLines, showDailyOpenLines).
Color settings: Weekend box, daily box, midpoints, open lines.
Text settings: Session name (showSessionName) and range size (showRangeSize).
What Are CME Gaps and How to Use Them?
CME gaps occur when Bitcoin’s spot market moves during CME’s closed hours (Friday 17:00 to Sunday 18:00). For example, if CME closes at 50,000 USDT on Friday and opens at 52,000 USDT on Sunday, a gap forms between 50,000-52,000. Studies suggest that over 70% of these gaps are "filled" (price revisits the gap zone).
Usage in Trading: Support and Resistance: Gap zones often act as support or resistance levels. For instance, a gap between 50,000-52,000 may resist price at 52,000 or support at 50,000.
Entry/Exit Points: Traders can use gaps for entry or exit. Buy when price dips to the gap’s lower bound, or sell when it hits the upper bound.
Market Sentiment: Large gaps indicate sharp weekend sentiment shifts, useful for gauging market direction.
Risk Management: Use gap levels for stop-loss or take-profit points.
Application: Add this indicator to your TradingView chart.
Customize settings: Show/hide weekend or daily sessions.
Choose “Friday” or “Sunday” for open lines.
Adjust colors and historical session counts.
To analyze CME gaps: Use weekend session boxes (Friday 17:00 - Sunday 18:00) to visualize gap zones.
Use Friday 17:00 or Sunday 18:00 open lines to mark gap start or end points.
Monitor price revisiting gap zones, confirming with other indicators (RSI, moving averages).
Notes: Best used on CME Bitcoin Futures (BTC1!) charts.
Not all gaps fill immediately; some may persist for weeks or months.
Questions? Drop a comment, and I’ll help promptly!

CJ - EMA Cross Scanner
EMA Cross Scanner
Fast EMAs: 33, 55 (red, blue lines)
Slow EMAs: 100, 200 (cloud)
When the Slow EMAs cross up, cloud turns green (bullish trend).
When the Slow EMAs cross down, cloud is red (bearish trend).
Strategy:
"Bullish Under/Over"
- Price deviates below the Fast EMAs
- Finds support into the Green Cloud
- Reclaims Fast EMAs
- Ignore this signal when the cloud is red.
"Bearish Over/Under"
- Price deviates above the Fast EMAs
- Finds resistance into the Red Cloud
- Closes back below Fast EMAs
- Ignore this signal when the cloud is green.

Quantum Dip Hunter | AlphaNattQuantum Dip Hunter | AlphaNatt
🎯 Overview
The Quantum Dip Hunter is an advanced technical indicator designed to identify high-probability buying opportunities when price temporarily dips below dynamic support levels. Unlike simple oversold indicators, this system uses a sophisticated quality scoring algorithm to filter out low-quality dips and highlight only the best entry points.
"Buy the dip" - but only the right dips. Not all dips are created equal.
⚡ Key Features
5 Detection Methods: Choose from Dynamic, Fibonacci, Volatility, Volume Profile, or Hybrid modes
Quality Scoring System: Each dip is scored from 0-100% based on multiple factors
Smart Filtering: Only signals above your quality threshold are displayed
Visual Effects: Glow, Pulse, and Wave animations for the support line
Risk Management: Automatic stop-loss and take-profit calculations
Real-time Statistics: Live dashboard showing current market conditions
📊 How It Works
The indicator calculates a dynamic support line using your selected method
When price dips below this line, it evaluates the dip quality
Quality score is calculated based on: trend alignment (30%), volume (20%), RSI (20%), momentum (15%), and dip depth (15%)
If the score exceeds your minimum threshold, a buy signal arrow appears
Stop-loss and take-profit levels are automatically calculated and displayed
🚀 Detection Methods Explained
Dynamic Support
Adapts to recent price action
Best for: Trending markets
Uses ATR-adjusted lowest points
Fibonacci Support
Based on 61.8% and 78.6% retracement levels
Best for: Pullbacks in strong trends
Automatically switches between fib levels
Volatility Support
Uses Bollinger Band methodology
Best for: Range-bound markets
Adapts to changing volatility
Volume Profile Support
Finds high-volume price levels
Best for: Identifying institutional support
Updates dynamically as volume accumulates
Hybrid Mode
Combines all methods for maximum accuracy
Best for: All market conditions
Takes the most conservative support level
⚙️ Key Settings
Dip Detection Engine
Detection Method: Choose your preferred support calculation
Sensitivity: Higher = more sensitive to price movements (0.5-3.0)
Lookback Period: How far back to analyze (20-200 bars)
Dip Depth %: Minimum dip size to consider (0.5-10%)
Quality Filters
Trend Filter: Only buy dips in uptrends when enabled
Minimum Dip Score: Quality threshold for signals (0-100%)
Trend Strength: Required trend score when filter is on
📈 Trading Strategies
Conservative Approach
Use Dynamic method with Trend Filter ON
Set minimum score to 80%
Risk:Reward ratio of 2:1 or higher
Best for: Swing trading
Aggressive Approach
Use Hybrid method with Trend Filter OFF
Set minimum score to 60%
Risk:Reward ratio of 1:1
Best for: Day trading
Scalping Setup
Use Volatility method
Set sensitivity to 2.0+
Focus on Target 1 only
Best for: Quick trades
🎨 Visual Customization
Color Themes:
Neon: Bright cyan/magenta for dark backgrounds
Ocean: Cool blues and teals
Solar: Warm yellows and oranges
Matrix: Classic green terminal look
Gradient: Smooth color transitions
Line Styles:
Solid: Clean, simple line
Glow: Adds depth with glow effect
Pulse: Animated breathing effect
Wave: Oscillating wave pattern
💡 Pro Tips
Start with the Trend Filter ON to avoid catching falling knives
Higher quality scores (80%+) have better win rates but fewer signals
Use Volume Profile method near major support/resistance levels
Combine with your favorite momentum indicator for confirmation
The pulse animation can help draw attention to key levels
⚠️ Important Notes
This indicator identifies potential entries, not guaranteed profits
Always use proper risk management
Works best on liquid instruments with good volume
Backtest your settings before live trading
Not financial advice - use at your own risk
📊 Statistics Panel
The live statistics panel shows:
Current detection method
Support level value
Trend direction
Distance from support
Current signal status
🤝 Support
Created by AlphaNatt
For questions or suggestions, please comment below!
Happy dip hunting! 🎯
Not financial advice, always do your own research

LBB + RSI Multi-Level + Compact TableBB and RSI scalping script for daily or scalp zone with signals

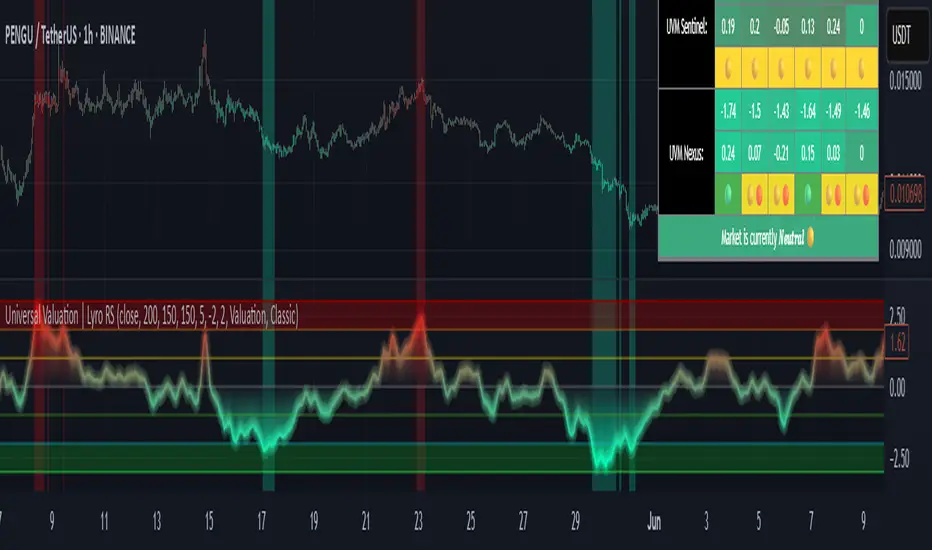
Universal Valuation | Lyro RSUniversal Valuation
⚠️Disclaimer: This indicator is a tool for technical analysis and does not provide guaranteed results. It should be used in conjunction with other analysis methods and proper risk management practices. The creators of this indicator are not responsible for any financial decisions made based on its signals.
Overview
The Universal Valuation indicator helps identify whether the market is undervalued/cheap or overvalued/expensive. And another mode this indicator offers is This cutting-edge tool works flawlessly ACROSS ALL TIMEFRAMES & TICKERS/CHARTS.
By combining regular TradingView indicators & some of our valuation indicators basic/simple with advanced statistical functions, this indicator offers a powerful, universal valuation tool.
Key Features
INPUTS: The Universal Valuation indicator offers flexibility through its customizable input sections. The "Indicator Settings" let you adjust lengths for the raw indicators and statistical functions. The "Signals" section defines thresholds for background color changes, helping you visually spot key market moments. The "Colors" section allows you to pick from pre-defined schemes or personalize colors for better clarity. Lastly, the "Tables" section gives you full control over the UV table’s size and positioning, including options to overlay it on the chart or place it in the allocated space.
A DEEPER INSIGHT: This indicator is built around three distinct categories: "UVM Andromeda," "UVM Sentinel," and "UVM Nexus." Each category has three different drivers. The statistical function powering this indicator is the Z-score. The Z-score is an incredibly powerful tool that helps determine if the market is overvalued/expensive or undervalued/cheap, offering critical insights for traders."
Plotting: The plotted value represents the average of all the drivers. In other words, it is the combined average of all 9 Z-scored indicators, providing a balanced and comprehensive market valuation.
What is Z-score? & Why does this system use it?
Z-score is an advanced statistical function used to measure how far a value deviates from the average in a data set. The formula for Z-score is: (x - h) / o, where x is the observed value, h is the average (mean) of the data set, and o is the standard deviation.
This system uses the Z-score because it helps determine whether the market is overvalued or undervalued based on historical data and how we apply the calculation. By measuring how far a value deviates from the average, the Z-score provides a clearer and more objective valuation of market conditions. In our case, a Z-score of -3 indicates an undervalued market, while a Z-score of 3 signals an overvalued market.
UVM Andromeda:
UVM stands for Universal Valuation Model, which is the core of this indicator. Andromeda, one of the most stunning galaxies in the universe, inspired by its name. We chose this name because a powerful indicator should not only be effective but also visually appealing.
You might be wondering what drives UVM Andromeda. The three key drivers are Price, RSI, and ROC. These indicators are pre-defined, while the "Indicator Settings" allow you to adjust the length of the Z-score calculation, refining how the model analyzes market conditions.
UVM Sentinel:
Sentinel, refers to a guard or watchman, someone or something that keeps watch and provides protection. In our case this name refers to a model that actively observes market conditions, acting as a vigilant tool that signals important shifts in valuation.
Wondering what drives UVM Sentinel? The three key drivers are BB%, CCI, and Crosby. While these indicators are simple on their own, applying our Z-score function elevates them to a whole new level, enhancing their ability to detect market conditions with greater accuracy.
UVM Nexus:
We chose the name Nexus simply because it sounds cool—there’s no deeper meaning behind it for us. However, the word itself does have a meaning; it refers to a connection or link between multiple things.
The three key drivers for UVM Nexus are the Sharpe, Sortino, and Omega ratios. These are all asset performance metrics, but by applying the Z-score, we transform them into powerful valuation indicators/drivers, giving you a deeper insight into market conditions.
Why do we use 9 different indicators instead of 1?
That's a great question, and the answer is quite simple. Think of it like this: if you have one super soldier, and they miss a shot, it’s game over. But if you have many soldiers, even if one misses, the others can step in and take the shot. The strength of using multiple indicators lies in their collective power – if one misses, the others still provide valuable insights, making the overall system more reliable.
Final Thoughts:
In our Universal Valuation indicator, you have the flexibility to customize it however you like using our inputs. The system is divided into three distinct categories, with each category containing three indicators. The value plotted on the chart is the average of all nine indicators. We apply the Z-score, an advanced statistical function, to each of these nine indicators. The final plotted average is the average of all the Z-scores, giving you a comprehensive and refined market valuation. This indicator can work on any timeframe & chart ticker.
Trend Continuation IndicatorTrend Continuation Indicator
The Trend Continuation Indicator is designed to assist traders in identifying potential continuation setups within established market trends. It is particularly suited for use in strong trending environments and is optimized for lower timeframes, with a recommended chart setting of 5-minute candles and an EMA timeframe set to 1 hour.
The indicator combines multiple technical elements:
RSI (Relative Strength Index): Used to assess potential overbought and oversold conditions relative to the trend.
EMA (Exponential Moving Average): A multi-timeframe EMA is used as a directional filter, helping to align entries with the broader trend.
Candle Structure and Momentum Filters: The logic includes real-time candle analysis and volume dynamics to identify momentum-driven signals.
Buy signals are generated when price action shows bullish momentum and RSI confirms potential oversold conditions within an uptrend. Conversely, sell signals are triggered when bearish momentum aligns with overbought RSI levels in a downtrend.
This tool is intended for use as part of a broader trading strategy and is best applied in trending markets where continuation patterns are more likely to follow through.
THE INDICATOR ITSELF IS NO FINANCIAL ADVISE!
Here are some usecase examples:

Momentum-Reversal System Signals Pro
Momentum-Reversal System Signals Pro
Overview
A sophisticated signaling system designed to identify high-probability trend-following entries after a price pullback. This indicator is optimized for index futures like the S&P 500 (ES/SPX) on a 5-minute timeframe .
It performs best during periods of established trends and lower volatility. To aid in this, the indicator includes a customizable "No-Trade Zone" highlighter, which is pre-set to the often volatile 8:30 AM - 11:30 AM EST market open. While the default settings are robust and effective in most conditions, the indicator is fully customizable to suit your specific trading style.
How It Works
The core logic is based on a three-step process to filter for high-quality setups:
Trend Confirmation: The script first establishes the overall market direction using an EMA on a higher timeframe (15-minute by default). This ensures you are only looking for trades that align with the dominant trend.
Pullback Detection: Once the trend is confirmed, the script waits for the price to pull back to a dynamic area of value on the main chart (5-minute by default). This "pullback zone" is defined by the 5m EMA and an ATR-based channel around it, which adapts to current market volatility.
Momentum Entry: After a valid pullback occurs, the script waits for a clear sign that momentum is returning in the direction of the primary trend. This is confirmed by a combination of a MACD crossover and a strong RSI reading, signaling that the pullback has likely ended and the trend is ready to resume.
Advanced Quality Filters
What makes this indicator powerful is its multi-layered filtering system designed to weed out low-probability signals and avoid choppy market conditions.
Trend Strength: It doesn't just check the trend direction; it measures the slope of the 15m EMA to ensure the trend has sufficient strength. This is a key filter for avoiding flat, sideways markets.
Momentum Confirmation: An RSI "Dead Zone" around the 50-level ensures that the RSI shows decisive momentum before a signal is generated.
Signal Cooldown: A built-in timer ( Min Bars Between Signals ) prevents the same signal from firing repeatedly in a short period, reducing noise and over-trading.
RSI Volatility: The script checks that the RSI itself is not flat, which is often a sign of market indecision and a precursor to chop.
Pullback Quality: An optional filter ensures that by the time the signal fires, the price has already moved back to the "correct" side of the 5m EMA, confirming the reversal's strength.
Volatility Filter: A crucial risk management filter that blocks signals on abnormally large, high-risk "gasoline" bars that could lead to immediate stops.
How To Use
For Long Signals (Green 'Long' Tag):
Look for the 15m EMA to be green and trending upwards.
Wait for price to pull back towards the orange 5m EMA.
A "Long" signal appears when momentum indicators confirm a reversal back in the direction of the trend.
For Short Signals (Red 'Short' Tag):
Look for the 15m EMA to be red and trending downwards.
Wait for price to pull back towards the orange 5m EMA.
A "Short" signal appears when momentum indicators confirm a reversal back in the direction of the trend.
This tool provides high-probability signals, not guarantees. It is designed to be a core component of a complete trading plan. Always use proper risk management and confluence from your own analysis.
Fine-Tuning & Customization
All settings are fully adjustable in the script's "Inputs" tab to match your risk tolerance and market conditions.
Timeframe & EMA Settings: Adjust the core moving averages that define the trend and pullback zones.
Pullback Settings: Define what constitutes a valid pullback by adjusting the lookback period and the size of the ATR-based "near" zone.
Quality Filters: This is the most important section for tailoring the script's strictness. Increase the EMA Slope, RSI Dead Zone, or Signal Cooldown to receive fewer but potentially higher-quality signals.
Advanced Filters: Enable or disable the Pullback Quality and Volatility filters for an extra layer of confirmation or risk management.
No-Trade Zone Highlighter: Adjust the session and timezone to highlight periods you wish to avoid, such as news events or low-liquidity hours.
Happy trading, and please use this tool responsibly.

Z Clean: SMA + Supertrend + Breakout + IntradaySMA+ST. if both green buy, or else sell, Trail SL when ST turns red on buy or green on Sell. MA will help to filter the chart when its sideways, i have see max 4/t trades on side days, but loss will be less as ST will change colour. I have kept the ATR close for fast entry and exit.

Trade Bằng Mông Xu hướngSure! Here is the English version of your TradingView indicator description:
📈 Key Highs and Lows Zones + Bob Volman Style (H1 Data)
A powerful tool combining price action and EMAs to identify market structure and trend changes with precision.
🧠 Description:
The "Key Highs and Lows Zones + Bob Volman Style" indicator is a smart market structure tool built on the 1-hour (H1) timeframe. It detects confirmed swing highs and lows using breakout logic, while integrating Bob Volman-style EMA bands (15, 21, 35) to visualize trend momentum.
This indicator helps you:
✅ Identify the primary market trend: Uptrend, Downtrend, or Neutral
✅ Mark confirmed swing highs/lows with clean visual labels and range lines
✅ Detect breakout shifts for early trend reversal signals
✅ Optionally display Neutral points with white dot (🔘) labels
✅ Visualize EMA bands to follow market flow with dynamic support/resistance

Session, Daily, and Weekly Opening Ranges [berkusa]Description:This indicator plots opening range boxes for major trading sessions (Sydney, Asia, Tokyo, Frankfurt, London, New York) as well as daily, weekly, and monthly ranges, helping traders identify key price levels for breakout and reversal strategies. Each box represents the high and low prices during the specified session or timeframe, with customizable durations and display options. For daily, weekly, and monthly ranges, a dotted silver midline (50% transparency) is drawn at the midpoint of the high and low, serving as a critical pivot level.Key Features:Session Ranges: Displays boxes for Sydney, Asia, Tokyo, Frankfurt, London, and New York sessions, capturing the high and low during user-defined session times (e.g., 15-minute windows).
Daily, Weekly, Monthly Ranges: Plots boxes for daily, weekly, and monthly opening ranges, with midlines to highlight key pivot levels.
Customizable Settings: Adjust session times, number of boxes displayed (e.g., 5 sessions, 3 daily, 2 weekly, 2 monthly), colors, and text visibility.
Text Labels: Shows session names and dates (e.g., "TOKYO Monday", "MONTHLY 2025-07") for easy identification.
Time Zone: Uses "America/New_York" for accurate session timing, with boxes capped at 500 bars to comply with Pine Script limitations.
How to Use for Trading:Session Openings: Session ranges (e.g., New York 09:30-09:45) capture the initial market volatility, ideal for breakout trading. Enter trades when the price breaks above the session high or below the session low, with stop-losses placed just outside the opposite boundary. For example, a breakout above the New York session high could target the next resistance level, with a stop below the session low.
Daily Ranges: Daily boxes highlight the day’s opening range (e.g., 00:00-00:15). The midline acts as a pivot: prices above it suggest bullish momentum, while prices below indicate bearish pressure. Use the midline for mean-reversion trades or as a reference for stop-loss placement.
Weekly and Monthly Ranges: These longer-term ranges identify significant support and resistance zones. The weekly and monthly midlines are key levels where price often reacts, making them ideal for swing trading or position trading. For instance, a rejection at the monthly midline could signal a reversal, while a breakout past the weekly high/low may indicate a trend continuation.
Trading Tips:Combine session breakouts with volume or momentum indicators to confirm entries.
Use daily midlines as targets for intra-day trades or as support/resistance for scalping.
Monitor weekly/monthly midlines for major reversals, especially near economic events or key price levels.
Importance of Key Levels:Daily Levels: The daily opening range and midline are critical for intra-day traders, as they define the day’s bias and potential reversal points. Prices often respect these levels during the session, providing high-probability setups.
Weekly Levels: Weekly ranges and midlines are significant for swing traders, as they reflect the market’s broader sentiment. Price reactions at these levels often align with macroeconomic events or trend changes.
Monthly Levels: Monthly ranges and midlines are pivotal for position traders and long-term investors. These levels act as major support/resistance zones, often influencing price for weeks or months. The monthly midline is especially important, as it frequently serves as a magnet for price or a barrier during strong trends.
Settings:Session Times: Customize session start/end times (e.g., "09:30-09:45" for New York).
Display Counts: Set the number of session (default: 5), daily (3), weekly (2), and monthly (2) boxes to display.
Colors: Adjust box colors for each session/range; midlines are silver with 50% transparency.
Show Session Name and Day: Enable/disable text labels for session names and dates.
Extra Days: Extend session/daily boxes by additional days (default: 1) for visibility.
Notes:Use a 5-minute or 15-minute timeframe for session and daily ranges, and a 1-hour or daily timeframe for weekly/monthly ranges to ensure boxes span meaningful periods.
On small timeframes (e.g., 1-minute), boxes may be capped at 500 bars (e.g., 8.33 hours), which may truncate weekly/monthly ranges. Higher timeframes (e.g., 1-hour) allow longer spans (e.g., 20.83 days).
Test the indicator on liquid markets (e.g., EUR/USD, SPX) for best results.
Author’s Note:
This indicator is designed for traders seeking to capitalize on opening range breakouts and key pivot levels. Combine with other technical tools and risk management for optimal results. Feedback is welcome!

EMA Pullback Indicator [ATR-based]🟦 EMA Pullback Indicator
This indicator identifies pullbacks in trending markets using the crossover of two EMAs (Fast and Slow). When a pullback occurs during a valid trend, an entry is triggered after price resumes in the trend direction. ATR is used to dynamically calculate stop-loss and take-profit levels.
🔍 Strategy Logic:
Trend Detection: EMA(8) vs EMA(21)
Pullback Zones:
In a bullish trend, a pullback is when price dips below the Fast EMA
In a bearish trend, a pullback is when price rises above the Fast EMA
Entry Trigger: Re-entry into trend direction after pullback
Stop Loss / Take Profit:
Based on ATR × SL/TP multipliers
Exit Options:
TP/SL Hit
Exit on new pullback (optional toggle)
Multiple Entry Toggle: Choose whether to allow multiple pullback entries or not
⚙️ Inputs:
Fast EMA Length
Slow EMA Length
ATR Period
SL Multiplier
TP Multiplier
Allow Multiple Entries
Exit on New Pullback
📊 Visuals:
Colored EMAs and fill zone between them
Grey bars during pullback
Blue/Black trend bar colors
Entry markers and TP/SL levels with labels
Real-time ATR display in corner
📢 Alerts Included:
Long/Short Pullback Entry
Take Profit Hit
Stop Loss Hit

3 EMA trong 1 NTT CAPITALThe 3 EMA in 1 NTT CAPITAL indicator provides an overview of the market trend with three EMAs of different periods, helping to identify entry and exit points more accurately, thus supporting traders in making quick and effective decisions.

Opening Range with Breakouts & Targets + Retest AlertsOpening Range with Breakouts & Targets + Retest Alerts
Opening Range Breakout strategy with custom sessions, breakout signals, dynamic targets, and smart retest alerts. Perfect for intraday traders seeking precision entries and high-probability setups.
This advanced ORB tool brings precision and flexibility to your trading by combining the Opening Range Breakout concept with retest confirmation, dynamic target projections, and custom session control.
Why Traders Love This Script
✅ High-Probability Setups – Breakouts with confirmation retests are statistically stronger.
✅ Custom Session Flexibility – Adapt the opening range to any market (Stocks, Forex, Crypto).
✅ Dynamic Targets – Automatically projected based on range size for clear profit objectives.
✅ Smart Alerts – Never miss a breakout retest opportunity with Unified Alert Conditions.
Features You’ll Get
✔ Opening Range Box – Marks the range for your selected timeframe or custom session.
✔ Breakout Arrows – Instant visual confirmation of bullish and bearish breakouts.
✔ Daily Bias Filter – Optional directional filter for higher accuracy.
✔ Dynamic Targets – Adaptive or extended display of projected targets.
✔ Retest Detection – Alerts when price retests the breakout zone after a breakout.
✔ Full Customization – Colors, text size, line styles, target styles, and more.
How to Use It
Set Your Opening Range – Default: 30 minutes after session open or choose a custom range.
Look for Breakouts – Signals appear when price closes beyond the range.
Wait for Retest – For higher confidence, enter on retest signals (green/red dots).
Manage Risk with Targets – Use dynamic target levels to plan your exits.
Pro Tip
Combine this indicator with EMA trend filters, VWAP, or volume confirmation for maximum precision.
Alerts
✅ Unified Break & Retest Alert – Fires when price successfully retests after a breakout, signaling a potential high-probability trade.
⚠ Disclaimer: This tool is for educational purposes only. Always use proper risk management and confirm with your own analysis before trading.

SQV Indicator Bridge# SQV Indicator Bridge - Quick Guide
## What is SQV Indicator Bridge?
A simple connector that validates your indicator's signals using SQV Lite before displaying them on the chart. Only high-quality signals pass through.
## How It Works
```
Your Indicator → Generates Signals → SQV Lite → Validates Quality → Bridge → Shows Only Valid Signals
```
## Quick Setup (3 Steps)
### Step 1: Prepare Your Indicator
Add these lines to export your signals:
```pinescript
// At the end of your indicator code
plot(longCondition ? 1 : 0, "Long Signal", display=display.none)
plot(shortCondition ? 1 : 0, "Short Signal", display=display.none)
```
### Step 2: Add to Chart (in order)
1. Your indicator
2. SQV Lite
3. SQV Indicator Bridge
### Step 3: Connect Sources
In Bridge settings:
- **Long Signal Source** → Select: YourIndicator: Long Signal
- **Short Signal Source** → Select: YourIndicator: Short Signal
- **SQV Long Valid** → Select: SQV Lite: SQV Long Valid
- **SQV Short Valid** → Select: SQV Lite: SQV Short Valid
- **SQV Score** → Select: SQV Lite: SQV Score
## Visual Settings
| Setting | Description | Default |
|---------|-------------|---------|
| Show Labels | Display BUY/SELL labels | On |
| Label Offset | Distance from candles (0-5 ATR) | 0 |
| Label Size | Tiny, Small, or Normal | Small |
| Long Color | Color for buy signals | Green |
| Short Color | Color for sell signals | Red |
## What You'll See
- **Green "LONG" labels** - When your buy signal passes SQV validation
- **Red "SHORT" labels** - When your sell signal passes SQV validation
- **No label** - When signal quality is too low
## Common Issues & Solutions
### No labels appearing?
1. Check "Use External Signals" is ON in SQV Lite
2. Verify source connections are correct
3. Lower minimum score in SQV Lite (try 60)
4. Test your indicator separately to ensure it generates signals
### Too many/few signals?
- Adjust "Minimum Quality Score" in SQV Lite
- Default is 65, lower for more signals, higher for fewer
### Wrong signals showing?
- Check Trading Mode in SQV Lite matches your strategy (Long Only/Short Only/Both)
## Example Integration
### Simple MA Cross Indicator
```pinescript
//@version=6
indicator("MA Cross with SQV", overlay=true)
// Your logic
fast = ta.sma(close, 20)
slow = ta.sma(close, 50)
longSignal = ta.crossover(fast, slow)
shortSignal = ta.crossunder(fast, slow)
// Plot MAs
plot(fast, color=color.blue)
plot(slow, color=color.red)
// Export for SQV Bridge (REQUIRED!)
plot(longSignal ? 1 : 0, "Long Signal", display=display.none)
plot(shortSignal ? 1 : 0, "Short Signal", display=display.none)
```
## Tips
✅ **DO**:
- Test in "Autonomous Mode" first (SQV Lite setting)
- Use clear signal names in your plots
- Keep signals binary (1 or 0)
❌ **DON'T**:
- Forget to add `display=display.none` to signal plots
- Use values other than 0 and 1 for signals
- Leave "Use External Signals" OFF in SQV Lite
## Alert Setup
1. Enable "Enable Alerts" in Bridge settings
2. Create alert on Bridge (not your indicator)
3. Alert message includes SQV score
Example alert: `"Long Signal Validated | Score: 85"`
## Complete Bridge Code
```pinescript
//@version=6
indicator("SQV Indicator Bridge", overlay=true)
// From your indicator
longSignal = input.source(close, "Long Signal Source", group="Signal Sources")
shortSignal = input.source(close, "Short Signal Source", group="Signal Sources")
// From SQV Lite
sqvLongValid = input.source(close, "SQV Long Valid", group="SQV Sources")
sqvShortValid = input.source(close, "SQV Short Valid", group="SQV Sources")
sqvScore = input.source(close, "SQV Score", group="SQV Sources")
// Settings
showLabels = input.bool(true, "Show Labels", group="Visual")
labelOffset = input.float(0.0, "Label Offset (ATR)", minval=0.0, maxval=5.0, step=0.5, group="Visual")
labelSize = input.string("small", "Label Size", options= , group="Visual")
longColor = input.color(color.green, "Long Color", group="Visual")
shortColor = input.color(color.red, "Short Color", group="Visual")
enableAlerts = input.bool(false, "Enable Alerts", group="Alerts")
// Logic
atr = ta.atr(14)
offset = labelOffset > 0 ? atr * labelOffset : 0
hasValidLong = longSignal > 0 and sqvLongValid > 0 and barstate.isconfirmed
hasValidShort = shortSignal > 0 and sqvShortValid > 0 and barstate.isconfirmed
// Show labels
if showLabels
if hasValidLong
label.new(bar_index, low - offset, "LONG",
style=label.style_label_up,
color=longColor,
textcolor=color.white,
size=labelSize == "tiny" ? size.tiny :
labelSize == "small" ? size.small : size.normal)
if hasValidShort
label.new(bar_index, high + offset, "SHORT",
style=label.style_label_down,
color=shortColor,
textcolor=color.white,
size=labelSize == "tiny" ? size.tiny :
labelSize == "small" ? size.small : size.normal)
// Alerts
if enableAlerts
if hasValidLong
alert("Long Signal Validated | Score: " + str.tostring(sqvScore, "#"), alert.freq_once_per_bar_close)
if hasValidShort
alert("Short Signal Validated | Score: " + str.tostring(sqvScore, "#"), alert.freq_once_per_bar_close)
```
---
**Need help?** Check the full SQV documentation or contact through TradingView messages.

Ultimate Market Structure [Alpha Extract]Ultimate Market Structure
A comprehensive market structure analysis tool that combines advanced swing point detection, imbalance zone identification, and intelligent break analysis to identify high-probability trading opportunities.Utilizing a sophisticated trend scoring system, this indicator classifies market conditions and provides clear signals for structure breaks, directional changes, and fair value gap detection with institutional-grade precision.
🔶 Advanced Swing Point Detection
Identifies pivot highs and lows using configurable lookback periods with optional close-based analysis for cleaner signals. The system automatically labels swing points as Higher Highs (HH), Lower Highs (LH), Higher Lows (HL), and Lower Lows (LL) while providing advanced classifications including "rising_high", "falling_high", "rising_low", "falling_low", "peak_high", and "valley_low" for nuanced market analysis.
swingHighPrice = useClosesForStructure ? ta.pivothigh(close, swingLength, swingLength) : ta.pivothigh(high, swingLength, swingLength)
swingLowPrice = useClosesForStructure ? ta.pivotlow(close, swingLength, swingLength) : ta.pivotlow(low, swingLength, swingLength)
classification = classifyStructurePoint(structureHighPrice, upperStructure, true)
significance = calculateSignificance(structureHighPrice, upperStructure, true)
🔶 Significance Scoring System
Each structure point receives a significance level on a 1-5 scale based on its distance from previous points, helping prioritize the most important levels. This intelligent scoring system ensures traders focus on the most meaningful structure breaks while filtering out minor noise.
🔶 Comprehensive Trend Analysis
Calculates momentum, strength, direction, and confidence levels using volatility-normalized price changes and multi-timeframe correlation. The system provides real-time trend state tracking with bullish (+1), bearish (-1), or neutral (0) direction assessment and 0-100 confidence scoring.
// Calculate trend momentum using rate of change and volatility
calculateTrendMomentum(lookback) =>
priceChange = (close - close ) / close * 100
avgVolatility = ta.atr(lookback) / close * 100
momentum = priceChange / (avgVolatility + 0.0001)
momentum
// Calculate trend strength using multiple timeframe correlation
calculateTrendStrength(shortPeriod, longPeriod) =>
shortMA = ta.sma(close, shortPeriod)
longMA = ta.sma(close, longPeriod)
separation = math.abs(shortMA - longMA) / longMA * 100
strength = separation * slopeAlignment
❓How It Works
🔶 Imbalance Zone Detection
Identifies Fair Value Gaps (FVGs) between consecutive candles where price gaps create unfilled areas. These zones are displayed as semi-transparent boxes with optional center line mitigation tracking, highlighting potential support and resistance levels where institutional players often react.
// Detect Fair Value Gaps
detectPriceImbalance() =>
currentHigh = high
currentLow = low
refHigh = high
refLow = low
if currentOpen > currentClose
if currentHigh - refLow < 0
upperBound = currentClose - (currentClose - refLow)
lowerBound = currentClose - (currentClose - currentHigh)
centerPoint = (upperBound + lowerBound) / 2
newZone = ImbalanceZone.new(
zoneBox = box.new(bar_index, upperBound, rightEdge, lowerBound,
bgcolor=bullishImbalanceColor, border_color=hiddenColor)
)
🔶 Structure Break Analysis
Determines Break of Structure (BOS) for trend continuation and Directional Change (DC) for trend reversals with advanced classification as "continuation", "reversal", or "neutral". The system compares pre-trend and post-trend states for each break, providing comprehensive trend change momentum analysis.
🔶 Intelligent Zone Management
Features partial mitigation tracking when price enters but doesn't fully fill zones, with automatic zone boundary adjustment during partial fills. Smart array management keeps only recent structure points for optimal performance while preventing duplicate signals from the same level.
🔶 Liquidity Zone Detection
Automatically identifies potential liquidity zones at key structure points for institutional trading analysis. The system tracks broken structure points and provides adaptive zone extension with configurable time-based limits for imbalance areas.
🔶 Visual Structure Mapping
Provides clear visual indicators including swing labels with color-coded significance levels, dashed lines connecting break points with BOS/DC labels, and break signals for continuation and reversal patterns. The adaptive zones feature smart management with automatic mitigation tracking.
🔶 Market Structure Interpretation
HH/HL patterns indicate bullish market structure with trend continuation likelihood, while LH/LL patterns signal bearish structure with downtrend continuation expected. BOS signals represent structure breaks in trend direction for continuation opportunities, while DC signals warn of potential reversals.
🔶 Performance Optimization
Automatic cleanup of old structure points (keeps last 8 points), recent break tracking (keeps last 5 break events), and efficient array management ensure smooth performance across all timeframes and market conditions.
Why Choose Ultimate Market Structure ?
This indicator provides traders with institutional-grade market structure analysis, combining multiple analytical approaches into one comprehensive tool. By identifying key structure levels, imbalance zones, and break patterns with advanced significance scoring, it helps traders understand market dynamics and position themselves for high-probability trade setups in alignment with smart money concepts. The sophisticated trend scoring system and intelligent zone management make it an essential tool for any serious trader looking to decode market structure with precision and confidence.

SuperTrend + Follow LineSuperTrend + Follow Line" two-indicator combination for measuring initial and final trend reactions and for poor
thank you kıvan özbilgiç

(Subak)Profit/Loss LineYou can automatically check the take profit/loss price compared to the current value. You can set up to 7.
This indicator simply guides the price and does not provide direction.

Combined: Strat Dashboard + FVG + M&E StarsSTRAT MIX + VECTOR + SUPPORT
In financial markets, support and resistance are fundamental concepts in technical analysis used to identify price levels where an asset's price tends to pause or reverse. They are essentially areas on a chart where buying or selling pressure is expected to be strong enough to temporarily halt or reverse the prevailing price trend.
Here's a breakdown:
* Support: This is a price level where an asset's downward movement is expected to stop due to increased buying interest. Think of it as a "floor" where demand is strong enough to prevent the price from falling further. When the price approaches a support level, buyers tend to step in, leading to a potential bounce or reversal upwards. The more times a price level has held as support in the past, the stronger it's generally considered.
* Resistance: This is a price level where an asset's upward movement is expected to stop due to increased selling interest. It acts like a "ceiling" where supply is strong enough to prevent the price from rising higher. When the price approaches a resistance level, sellers tend to step in, leading to a potential pullback or reversal downwards. Similar to support, the more times a price level has acted as resistance, the more significant it's often seen.
Key characteristics:
* Supply and Demand: Support and resistance levels are a reflection of the continuous interplay between supply (sellers) and demand (buyers) in the market.
* Dynamic Nature: These levels are not fixed lines but rather zones. They can also "flip roles"; if a resistance level is broken and the price moves above it, that former resistance can then become a new support level, and vice-versa.
* Psychological Importance: These levels often derive their strength from collective market psychology, as many traders and investors recognize and react to the same price points.

TREV Candles - Range-Based Trend ReversalTREV Candles - Range-Based Trend Reversal Chart Implementation
What is a Trend Reversal (TREV) Chart?
A Trend Reversal chart, also known as a Point & Figure chart variation, is a unique charting method that focuses on price movement thresholds rather than time intervals. Unlike traditional candlestick charts where each candle represents a fixed time period, TREV candles form only when price moves by predefined amounts in ticks.
TREV charts eliminate time-based noise and focus purely on significant price movements, making them ideal for identifying genuine trend changes and continuation patterns.
How TREV Candles Work
This indicator implements true TREV logic with two critical thresholds:
Trend Size: The number of ticks price must move in the current direction to form a trend continuation candle
Reversal Size: The number of ticks price must move against the current direction to form a reversal candle and change the overall trend direction
Key TREV Rules Enforced:
Direction Changes Only Through Reversals: You cannot go from bullish trend directly to bearish trend - a reversal candle must occur first
Threshold-Based Formation: Candles form only when price thresholds are breached, not on time
Logical Wick Placement: Wicks only appear on the "open" side of candles where price temporarily moved against the formation direction
Multiple Candles Per Bar: When price moves significantly, several TREV candles can form within a single time-based bar
Four Distinct Candle Types
Bullish Trend (Green): Continues upward movement when trend threshold is hit
Bearish Trend (Red): Continues downward movement when trend threshold is hit
Bullish Reversal (Blue): Changes from bearish to bullish direction when reversal threshold is breached
Bearish Reversal (Orange): Changes from bullish to bearish direction when reversal threshold is breached
Practical Trading Applications
Trend Identification: Clear visual representation of when trends are continuing vs. reversing
Noise Reduction: Filters out insignificant price movements that don't meet threshold requirements
Support/Resistance: TREV levels often act as significant support and resistance zones
Breakout Confirmation: When price forms multiple trend candles in succession, it confirms strong directional movement
Reversal Signals: Reversal candles provide early warning of potential trend changes
Technical Implementation Features
Intelligent Price Path Processing: Analyzes the assumed price path within each bar (Low→High→Close for bullish bars, High→Low→Close for bearish bars)
Automatic Tick Size Detection: Works with any instrument by automatically detecting the correct tick size
Manual Override Option: Allows manual tick size specification for custom analysis
Impossible Scenario Prevention: Built-in logic prevents impossible wick configurations and direction changes
PineScript Optimization: Efficient state management and drawing limits handling for smooth performance
Comprehensive Styling Options
Each of the four candle types offers complete visual customization:
Body Colors: Independent color settings for each candle type's body
Border Colors: Separate border color customization
Border Styles: Choose from solid, dashed, or dotted borders
Wick Colors: Individual wick color settings for each candle type
Default Color Scheme:
🟢 Bullish Trend: Green body and wicks
🔵 Bullish Reversal: Blue body and wicks
🔴 Bearish Trend: Red body and wicks
🟠 Bearish Reversal: Orange body and wicks
Configuration Guidelines
Trend Size: Larger values create fewer, more significant trend candles. Smaller values increase sensitivity
Reversal Size: Should typically be smaller than trend size. Controls how easily the trend direction can change
Tick Size: Use "auto" for most instruments. Manual override useful for custom point values or backtesting
Ideal Use Cases
Swing Trading: Identify major trend changes and continuation patterns
Scalping: Use smaller thresholds to catch quick reversals and momentum shifts
Position Trading: Use larger thresholds to filter noise and focus on major trend moves
Multi-Timeframe Analysis: Compare TREV patterns across different threshold settings
Support/Resistance Trading: TREV close levels often become significant price zones
Why This Implementation is Superior
True TREV Logic: Enforces proper trend reversal rules that many implementations ignore
No Impossible Scenarios: Prevents wicks on both sides of candles and impossible direction changes
Professional Visualization: Clean, customizable appearance suitable for serious analysis
Performance Optimized: Handles large datasets without lag or drawing limit issues
Educational Value: Helps traders understand the difference between time-based and threshold-based charting
Perfect for traders who want to see beyond time-based noise and focus on what price is actually doing - moving in significant, measurable amounts that matter for trading decisions.

Algo Sniper Signal (Visual Style)Algo Sniper Signal (Visual Style) – Trading Bot Description
The Algo Sniper Signal is a visual trading bot that combines multiple technical indicators to generate reliable long and short entry signals. Its goal is to provide clear and precise trade signals based on proven strategies, highlighted directly on the chart for easy interpretation.
Key Features:
Multi-Indicator Setup: Utilizes EMA (14), SMA (9), RSI (14), ADX (14), and MACD Histogram to generate signals.
Long and Short Signals: Only one active signal is shown at a time; new signals are triggered only after a confirmed reversal in the opposite direction.
Trade Limitation: Allows only one trade per day to avoid overtrading.
Visual Representation: Signal zones are displayed as colored boxes on the chart, along with green long and red short labels.
Trailing Stop Visualization: Optional visual trailing stop loss displayed directly on the chart.
Indicator Dashboard: A clear, concise table at the bottom right of the chart displays the current status of all indicators.

TeeLek-HedgingLineXThis indicator is suitable for use with charts that are Down Trend and are about to change to Sideway or Up Trend. It works opposite to another indicator that I created called TeeLek Hedging Line.
Calculation method :
We will use the Highest value of 600 candlesticks in the past to create the average line. After that, we will create the All Time Low line.
How to use :
It is used to tell that this point is the lowest historical High value. This means that this is the point where the best Short buyers start to reach the loss point. At the same time, it is the point where the worst Long buyers start to make a profit. Therefore, it is suitable to be the point of changing from Down Trend to Up Trend.
There are 2 lines that are used to divide the range. If the graph is at the bottom, it will be Down Trend. If the graph is in the middle, it will be Sideway. And if the graph is at the top of both lines, it will be Up Trend.
//-------------------------------------------------------------------
อินดิเคเตอร์นี้ เหมาะสำหรับใช้กับกราฟที่เป็น Down Trend และกำลังจะเปลี่ยนเป็น Sideway หรือ Up Trend จะทำงานตรงข้ามกับ อินดิเคเตอร์อีกตัวที่ผมสร้างขึ้นมา ที่ชื่อว่า TeeLek Hedging Line
วิธีการคำนวณ
เราจะใช้ค่า Highest 600 แท่งเทียนย้อนหลัง ในการสร้างเส้นค่าเฉลี่ย หลังจากนั้น ก็จะสร้างเส้น All Time Low ขึ้นมา
วิธีใช้งาน
เอาไว้บอกว่า จุดนี้คือ ค่า High ย้อนหลังที่ต่ำที่สุด หมายความว่า นี่คือจุดที่คนซื้อ Short ที่ดีที่สุดก็เริ่มถึงจุดขาดทุน ขณะเดียวกัน ก็เป็นจุดที่คนที่ซื้อ Long ที่แย่ที่สุด เริ่มกำไร จึงเหมาะจะเป็นจุดเปลี่ยนจาก Down Trend ไปเป็น Up Trend
มี 2 เส้น ก็เอาไว้ใช้แบ่งช่วง ถ้ากราฟอยู่ด้านล่าง จะเป็น Down Trend ถ้ากราฟอยู่ระหว่างกลางก็จะเป็น Sideway และถ้ากราฟอยู่ด้านบนของทั้งสองเส้น ก็จะเป็น Up Trend

✅ TrendSniper Pro✅ SPNIPER ENTRY – Precision Trend Reversal Signals
The SPNIPER ENTRY is a smart trend-following and reversal indicator designed for traders who want timely entries, clear trend confirmation, and clean visuals.
Key Features:
✅ Triple TEMA Trend Confirmation (21, 50, 200): Ensures you're entering only when all moving averages agree on direction.
🎯 Dip/Top Detection: Uses pivot analysis and ATR proximity to detect ideal pullback entries in the prevailing trend.
📉 Stop Loss & Take Profit Zones: ATR-based dynamic SL/TP levels plotted automatically.
📛 False Signal Filter: Avoids multiple entries by maintaining a position until an opposite signal occurs.
📊 Clean Chart Coloring: Candles turn green for confirmed uptrend and red for downtrend—easy to follow.
🔔 Built-in Alerts: Be notified when conditions align perfectly for a high-probability trade.
👁️ Optional TEMA Display: Toggle visibility of trend components for deeper insight.
How it Works:
A buy signal occurs only when:
All 3 TEMA slopes are positive
Price pulls back near a recent pivot low (dip)
A valid uptrend is in place
A sell signal occurs only when:
All 3 TEMA slopes are negative
Price nears a recent pivot high (top)
A confirmed downtrend is active
This indicator is ideal for swing traders, intraday traders, and scalpers who want precise entries based on structure, slope, and volatility.
