Quantum Dip Hunter | AlphaNattQuantum Dip Hunter | AlphaNatt
🎯 Overview
The Quantum Dip Hunter is an advanced technical indicator designed to identify high-probability buying opportunities when price temporarily dips below dynamic support levels. Unlike simple oversold indicators, this system uses a sophisticated quality scoring algorithm to filter out low-quality dips and highlight only the best entry points.
"Buy the dip" - but only the right dips. Not all dips are created equal.
⚡ Key Features
5 Detection Methods: Choose from Dynamic, Fibonacci, Volatility, Volume Profile, or Hybrid modes
Quality Scoring System: Each dip is scored from 0-100% based on multiple factors
Smart Filtering: Only signals above your quality threshold are displayed
Visual Effects: Glow, Pulse, and Wave animations for the support line
Risk Management: Automatic stop-loss and take-profit calculations
Real-time Statistics: Live dashboard showing current market conditions
📊 How It Works
The indicator calculates a dynamic support line using your selected method
When price dips below this line, it evaluates the dip quality
Quality score is calculated based on: trend alignment (30%), volume (20%), RSI (20%), momentum (15%), and dip depth (15%)
If the score exceeds your minimum threshold, a buy signal arrow appears
Stop-loss and take-profit levels are automatically calculated and displayed
🚀 Detection Methods Explained
Dynamic Support
Adapts to recent price action
Best for: Trending markets
Uses ATR-adjusted lowest points
Fibonacci Support
Based on 61.8% and 78.6% retracement levels
Best for: Pullbacks in strong trends
Automatically switches between fib levels
Volatility Support
Uses Bollinger Band methodology
Best for: Range-bound markets
Adapts to changing volatility
Volume Profile Support
Finds high-volume price levels
Best for: Identifying institutional support
Updates dynamically as volume accumulates
Hybrid Mode
Combines all methods for maximum accuracy
Best for: All market conditions
Takes the most conservative support level
⚙️ Key Settings
Dip Detection Engine
Detection Method: Choose your preferred support calculation
Sensitivity: Higher = more sensitive to price movements (0.5-3.0)
Lookback Period: How far back to analyze (20-200 bars)
Dip Depth %: Minimum dip size to consider (0.5-10%)
Quality Filters
Trend Filter: Only buy dips in uptrends when enabled
Minimum Dip Score: Quality threshold for signals (0-100%)
Trend Strength: Required trend score when filter is on
📈 Trading Strategies
Conservative Approach
Use Dynamic method with Trend Filter ON
Set minimum score to 80%
Risk:Reward ratio of 2:1 or higher
Best for: Swing trading
Aggressive Approach
Use Hybrid method with Trend Filter OFF
Set minimum score to 60%
Risk:Reward ratio of 1:1
Best for: Day trading
Scalping Setup
Use Volatility method
Set sensitivity to 2.0+
Focus on Target 1 only
Best for: Quick trades
🎨 Visual Customization
Color Themes:
Neon: Bright cyan/magenta for dark backgrounds
Ocean: Cool blues and teals
Solar: Warm yellows and oranges
Matrix: Classic green terminal look
Gradient: Smooth color transitions
Line Styles:
Solid: Clean, simple line
Glow: Adds depth with glow effect
Pulse: Animated breathing effect
Wave: Oscillating wave pattern
💡 Pro Tips
Start with the Trend Filter ON to avoid catching falling knives
Higher quality scores (80%+) have better win rates but fewer signals
Use Volume Profile method near major support/resistance levels
Combine with your favorite momentum indicator for confirmation
The pulse animation can help draw attention to key levels
⚠️ Important Notes
This indicator identifies potential entries, not guaranteed profits
Always use proper risk management
Works best on liquid instruments with good volume
Backtest your settings before live trading
Not financial advice - use at your own risk
📊 Statistics Panel
The live statistics panel shows:
Current detection method
Support level value
Trend direction
Distance from support
Current signal status
🤝 Support
Created by AlphaNatt
For questions or suggestions, please comment below!
Happy dip hunting! 🎯
Not financial advice, always do your own research
Göstergeler ve stratejiler

LBB + RSI Multi-Level + Compact TableBB and RSI scalping script for daily or scalp zone with signals


Ultimate Market Structure [Alpha Extract]Ultimate Market Structure
A comprehensive market structure analysis tool that combines advanced swing point detection, imbalance zone identification, and intelligent break analysis to identify high-probability trading opportunities.Utilizing a sophisticated trend scoring system, this indicator classifies market conditions and provides clear signals for structure breaks, directional changes, and fair value gap detection with institutional-grade precision.
🔶 Advanced Swing Point Detection
Identifies pivot highs and lows using configurable lookback periods with optional close-based analysis for cleaner signals. The system automatically labels swing points as Higher Highs (HH), Lower Highs (LH), Higher Lows (HL), and Lower Lows (LL) while providing advanced classifications including "rising_high", "falling_high", "rising_low", "falling_low", "peak_high", and "valley_low" for nuanced market analysis.
swingHighPrice = useClosesForStructure ? ta.pivothigh(close, swingLength, swingLength) : ta.pivothigh(high, swingLength, swingLength)
swingLowPrice = useClosesForStructure ? ta.pivotlow(close, swingLength, swingLength) : ta.pivotlow(low, swingLength, swingLength)
classification = classifyStructurePoint(structureHighPrice, upperStructure, true)
significance = calculateSignificance(structureHighPrice, upperStructure, true)
🔶 Significance Scoring System
Each structure point receives a significance level on a 1-5 scale based on its distance from previous points, helping prioritize the most important levels. This intelligent scoring system ensures traders focus on the most meaningful structure breaks while filtering out minor noise.
🔶 Comprehensive Trend Analysis
Calculates momentum, strength, direction, and confidence levels using volatility-normalized price changes and multi-timeframe correlation. The system provides real-time trend state tracking with bullish (+1), bearish (-1), or neutral (0) direction assessment and 0-100 confidence scoring.
// Calculate trend momentum using rate of change and volatility
calculateTrendMomentum(lookback) =>
priceChange = (close - close ) / close * 100
avgVolatility = ta.atr(lookback) / close * 100
momentum = priceChange / (avgVolatility + 0.0001)
momentum
// Calculate trend strength using multiple timeframe correlation
calculateTrendStrength(shortPeriod, longPeriod) =>
shortMA = ta.sma(close, shortPeriod)
longMA = ta.sma(close, longPeriod)
separation = math.abs(shortMA - longMA) / longMA * 100
strength = separation * slopeAlignment
❓How It Works
🔶 Imbalance Zone Detection
Identifies Fair Value Gaps (FVGs) between consecutive candles where price gaps create unfilled areas. These zones are displayed as semi-transparent boxes with optional center line mitigation tracking, highlighting potential support and resistance levels where institutional players often react.
// Detect Fair Value Gaps
detectPriceImbalance() =>
currentHigh = high
currentLow = low
refHigh = high
refLow = low
if currentOpen > currentClose
if currentHigh - refLow < 0
upperBound = currentClose - (currentClose - refLow)
lowerBound = currentClose - (currentClose - currentHigh)
centerPoint = (upperBound + lowerBound) / 2
newZone = ImbalanceZone.new(
zoneBox = box.new(bar_index, upperBound, rightEdge, lowerBound,
bgcolor=bullishImbalanceColor, border_color=hiddenColor)
)
🔶 Structure Break Analysis
Determines Break of Structure (BOS) for trend continuation and Directional Change (DC) for trend reversals with advanced classification as "continuation", "reversal", or "neutral". The system compares pre-trend and post-trend states for each break, providing comprehensive trend change momentum analysis.
🔶 Intelligent Zone Management
Features partial mitigation tracking when price enters but doesn't fully fill zones, with automatic zone boundary adjustment during partial fills. Smart array management keeps only recent structure points for optimal performance while preventing duplicate signals from the same level.
🔶 Liquidity Zone Detection
Automatically identifies potential liquidity zones at key structure points for institutional trading analysis. The system tracks broken structure points and provides adaptive zone extension with configurable time-based limits for imbalance areas.
🔶 Visual Structure Mapping
Provides clear visual indicators including swing labels with color-coded significance levels, dashed lines connecting break points with BOS/DC labels, and break signals for continuation and reversal patterns. The adaptive zones feature smart management with automatic mitigation tracking.
🔶 Market Structure Interpretation
HH/HL patterns indicate bullish market structure with trend continuation likelihood, while LH/LL patterns signal bearish structure with downtrend continuation expected. BOS signals represent structure breaks in trend direction for continuation opportunities, while DC signals warn of potential reversals.
🔶 Performance Optimization
Automatic cleanup of old structure points (keeps last 8 points), recent break tracking (keeps last 5 break events), and efficient array management ensure smooth performance across all timeframes and market conditions.
Why Choose Ultimate Market Structure ?
This indicator provides traders with institutional-grade market structure analysis, combining multiple analytical approaches into one comprehensive tool. By identifying key structure levels, imbalance zones, and break patterns with advanced significance scoring, it helps traders understand market dynamics and position themselves for high-probability trade setups in alignment with smart money concepts. The sophisticated trend scoring system and intelligent zone management make it an essential tool for any serious trader looking to decode market structure with precision and confidence.

Область Покупателя/Продавца (Упрощённая версия)Buyer/Seller Zones — Simplified Version
This indicator highlights key candles with increased buyer or seller activity based on anomalous volume and volatility. These candles often mark the beginning of significant price moves.
After detection, the indicator plots zones of interest, which traders can monitor for potential retests or reaction areas.
How to use:
These levels can act as reference points for limit entries on retests.
However, not every zone should be traded blindly. It is strongly advised to combine with other tools (e.g., trend context, volume confirmation, higher timeframe structure).
Note: Display customization is available — choose between box, circle, or diamond highlights, and tune volume/volatility filters to your needs.

Momentum-Reversal System Signals Pro
Momentum-Reversal System Signals Pro
Overview
A sophisticated signaling system designed to identify high-probability trend-following entries after a price pullback. This indicator is optimized for index futures like the S&P 500 (ES/SPX) on a 5-minute timeframe .
It performs best during periods of established trends and lower volatility. To aid in this, the indicator includes a customizable "No-Trade Zone" highlighter, which is pre-set to the often volatile 8:30 AM - 11:30 AM EST market open. While the default settings are robust and effective in most conditions, the indicator is fully customizable to suit your specific trading style.
How It Works
The core logic is based on a three-step process to filter for high-quality setups:
Trend Confirmation: The script first establishes the overall market direction using an EMA on a higher timeframe (15-minute by default). This ensures you are only looking for trades that align with the dominant trend.
Pullback Detection: Once the trend is confirmed, the script waits for the price to pull back to a dynamic area of value on the main chart (5-minute by default). This "pullback zone" is defined by the 5m EMA and an ATR-based channel around it, which adapts to current market volatility.
Momentum Entry: After a valid pullback occurs, the script waits for a clear sign that momentum is returning in the direction of the primary trend. This is confirmed by a combination of a MACD crossover and a strong RSI reading, signaling that the pullback has likely ended and the trend is ready to resume.
Advanced Quality Filters
What makes this indicator powerful is its multi-layered filtering system designed to weed out low-probability signals and avoid choppy market conditions.
Trend Strength: It doesn't just check the trend direction; it measures the slope of the 15m EMA to ensure the trend has sufficient strength. This is a key filter for avoiding flat, sideways markets.
Momentum Confirmation: An RSI "Dead Zone" around the 50-level ensures that the RSI shows decisive momentum before a signal is generated.
Signal Cooldown: A built-in timer ( Min Bars Between Signals ) prevents the same signal from firing repeatedly in a short period, reducing noise and over-trading.
RSI Volatility: The script checks that the RSI itself is not flat, which is often a sign of market indecision and a precursor to chop.
Pullback Quality: An optional filter ensures that by the time the signal fires, the price has already moved back to the "correct" side of the 5m EMA, confirming the reversal's strength.
Volatility Filter: A crucial risk management filter that blocks signals on abnormally large, high-risk "gasoline" bars that could lead to immediate stops.
How To Use
For Long Signals (Green 'Long' Tag):
Look for the 15m EMA to be green and trending upwards.
Wait for price to pull back towards the orange 5m EMA.
A "Long" signal appears when momentum indicators confirm a reversal back in the direction of the trend.
For Short Signals (Red 'Short' Tag):
Look for the 15m EMA to be red and trending downwards.
Wait for price to pull back towards the orange 5m EMA.
A "Short" signal appears when momentum indicators confirm a reversal back in the direction of the trend.
This tool provides high-probability signals, not guarantees. It is designed to be a core component of a complete trading plan. Always use proper risk management and confluence from your own analysis.
Fine-Tuning & Customization
All settings are fully adjustable in the script's "Inputs" tab to match your risk tolerance and market conditions.
Timeframe & EMA Settings: Adjust the core moving averages that define the trend and pullback zones.
Pullback Settings: Define what constitutes a valid pullback by adjusting the lookback period and the size of the ATR-based "near" zone.
Quality Filters: This is the most important section for tailoring the script's strictness. Increase the EMA Slope, RSI Dead Zone, or Signal Cooldown to receive fewer but potentially higher-quality signals.
Advanced Filters: Enable or disable the Pullback Quality and Volatility filters for an extra layer of confirmation or risk management.
No-Trade Zone Highlighter: Adjust the session and timezone to highlight periods you wish to avoid, such as news events or low-liquidity hours.
Happy trading, and please use this tool responsibly.

Auto Intelligence Selective Moving Average(AI/MA)# 🤖 Auto Intelligence Moving Average Strategy (AI/MA)
**AI/MA** is a state-adaptive moving average crossover strategy designed to **maximize returns from golden cross / death cross logic** by intelligently switching between different MA types and parameters based on market conditions.
---
## 🎯 Objective
To build a moving average crossover strategy that:
- **Adapts dynamically** to market regimes (trend vs range, rising vs falling)
- **Switches intelligently** between SMA, EMA, RMA, and HMA
- **Maximizes cumulative return** under realistic backtesting
---
## 🧪 materials amd methods
- **MA Types Considered**: SMA, EMA, RMA, HMA
- **Parameter Ranges**: Periods from 5 to 40
- **Market Conditions Classification**:
- Based on the slope of a central SMA(20) line
- And the relative position of price to the central line
- Resulting in 4 regimes: A (Bull), B (Pullback), C (Rebound), D (Bear)
- **Optimization Dataset**:
- **Bybit BTCUSDT.P**
- **1-hour candles**
- **2024 full-year**
- **Search Process**:
- **Random search**: 200 parameter combinations
- Evaluated by:
- `Cumulative PnL`
- `Sharpe Ratio`
- `Max Drawdown`
- `R² of linear regression on cumulative PnL`
- **Implementation**:
- Optimization performed in **Python (Pandas + Matplotlib + Optuna-like logic)**
- Final parameters ported to **Pine Script (v5)** for TradingView backtesting
---
## 📈 Performance Highlights (on optimization set)
| Timeframe | Return (%) | Notes |
|-----------|------------|----------------------------|
| 6H | +1731% | Strongest performance |
| 1D | +1691% | Excellent trend capture |
| 12H | +1438% | Balance of trend/range |
| 5min | +27.3% | Even survives scalping |
| 1min | +9.34% | Robust against noise |
- Leverage: 100x
- Position size: 100%
- Fees: 0.055%
- Margin calls: **none** 🎯
---
## 🛠 Technology Stack
- `Python` for data handling and optimization
- `Pine Script v5` for implementation and visualization
- Fully state-aware strategy, modular and extendable
---
## ✨ Final Words
This strategy is **not curve-fitted**, **not over-parameterized**, and has been validated across multiple timeframes. If you're a fan of dynamic, intelligent technical systems, feel free to use and expand it.
💡 The future of simple-yet-smart trading begins here.

Auto Market Structure BOS & CHOCH [TeamCash]Auto Market Structure
The Auto Market Structure (AMS) indicator automatically maps market structure to guide your trading. Using pivot points, it plots lines and labels to identify Break of Structure (BOS)—a price break of a key level signaling trend continuation—and Change of Character (CHOCH)—a shift in market direction after breaking a swing high/low. How It Works: BITSTAMP:BTCUSD BITSTAMP:ETHUSD AMS detects pivot points across multiple timeframes, marking BOS and CHOCH with white lines (solid for confirmed, dotted for potential) and labels. It automatically tracks level crosses, highlighting trend shifts or continuations. Optional Fibonacci lines (yellow) can be enabled for precise entry and target zones.
Why Use AMS?
Automates market structure analysis for faster, clearer setups.
Pairs with Fibonacci for high-probability entry and exit points.
Works across timeframes, despite minor bugs, for versatile trading.
Ideal for traders combining structure and Fibonacci in BITSTAMP:BTCUSD and BITSTAMP:ETHUSD markets, offering a powerful, evolving tool for technical analysis.

Trend Continuation IndicatorTrend Continuation Indicator
The Trend Continuation Indicator is designed to assist traders in identifying potential continuation setups within established market trends. It is particularly suited for use in strong trending environments and is optimized for lower timeframes, with a recommended chart setting of 5-minute candles and an EMA timeframe set to 1 hour.
The indicator combines multiple technical elements:
RSI (Relative Strength Index): Used to assess potential overbought and oversold conditions relative to the trend.
EMA (Exponential Moving Average): A multi-timeframe EMA is used as a directional filter, helping to align entries with the broader trend.
Candle Structure and Momentum Filters: The logic includes real-time candle analysis and volume dynamics to identify momentum-driven signals.
Buy signals are generated when price action shows bullish momentum and RSI confirms potential oversold conditions within an uptrend. Conversely, sell signals are triggered when bearish momentum aligns with overbought RSI levels in a downtrend.
This tool is intended for use as part of a broader trading strategy and is best applied in trending markets where continuation patterns are more likely to follow through.
THE INDICATOR ITSELF IS NO FINANCIAL ADVISE!
Here are some usecase examples:

Trend Buy/Sell Fibonacci Range - KLTThe Trend Buy/Sell Fibonacci Range – KLT indicator identifies bullish and bearish trends based on where the closing price is located within a Fibonacci range calculated from the last N candles (default is 10). Instead of analyzing individual candles, this tool takes a broader view of price action using Fibonacci retracement levels across a dynamic multi-candle range.
How It Works:
Range Calculation
The indicator calculates the highest high and lowest low over the last N candles to define the active price range (default: 10 bars).
Fibonacci Levels
Within this range, Fibonacci levels (0.236, 0.382, 0.5, 0.618, 0.786) are dynamically computed. These levels act as internal thresholds to evaluate bullish or bearish pressure.
Trend Identification (via Close Position):
If the closing price is above the 0.618 level, it indicates strong buy pressure → the candle turns green and an upward triangle appears.
If the closing price is below the 0.382 level, it suggests strong sell pressure → the candle turns red and a downward triangle is displayed.
If the close lies between 0.382 and 0.618, the market is considered neutral, and the candle is gray.
Visual Elements:
Colored candles to immediately spot trend conditions.
Triangle signals (optional) for clear Buy/Sell markers.
Fibonacci level lines plotted on the chart for full context (can be toggled on/off).
Customization Options:
Lookback period (number of candles to calculate the range)
Fibonacci threshold levels (upper/lower)
Show/hide arrows and Fibonacci lines
Why Use This Indicator?
This tool is perfect for traders who want a simple visual method to assess trend strength based on price structure, not indicators derived from lagging moving averages. It offers:
Cleaner market structure analysis
Objective trend zones
Customizable sensitivity
Recommended Use:
Works well in conjunction with support/resistance zones, volume, or momentum indicators.
Applicable to any asset class or timeframe.
Credits:
Developed by KLT, combining structure-based logic with Fibonacci precision.

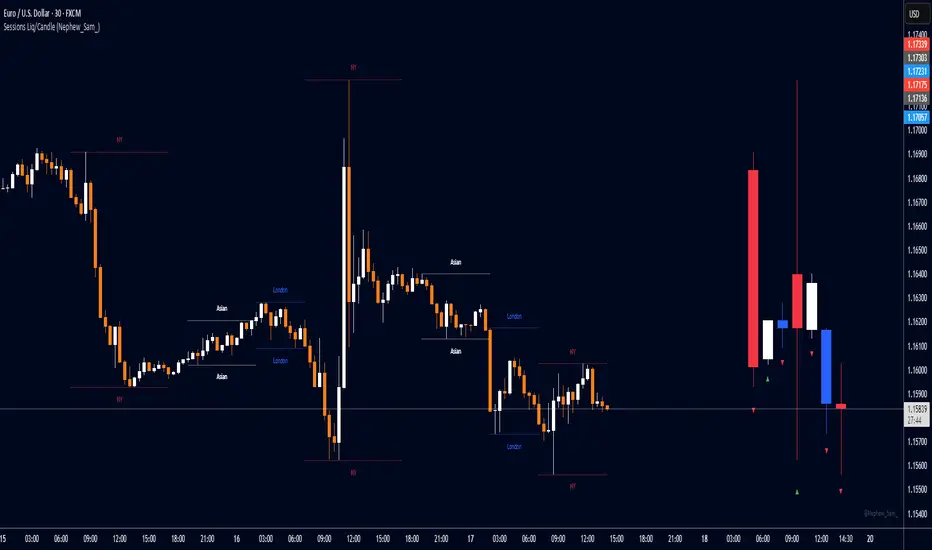
Session HL + Candles + AMD (Nephew_Sam_)Session HL + Candles + AMD (Nephew_Sam_)
This indicator marks out intraday sessions summarized into single candles, with an additional option to mark out the HL of each session. Perfect for understanding AMD within a glance (accumulation-manipulation-distribution)
Features:
Session High/Low lines with customizable colors and labels
Optional session candles displayed on the right side of the chart
Timezone support for global traders
Customizable bull/bear candle colors
Works on timeframes up to 1 hour
Perfect for:
Identifying session liquidity levels
Tracking session ranges and breakouts
Multi-timeframe session analysis
ICT methodology traders
Settings:
Choose your timezone for accurate session detection
Toggle session candles and HL lines independently
Customize colors, line styles, and labels
Set maximum timeframe (up to 1 hour)
Apex Edge - RSI Trend LinesThe Apex Edge - RSI Trend Lines indicator is a precision tool that automatically draws real-time trendlines on the RSI oscillator using confirmed pivot highs and lows. These dynamic trendlines track RSI structure in motion, helping you anticipate breakout zones, reversals, and hidden divergences.
Every time a new pivot forms, the indicator automatically re-draws the RSI trendline between the two most recent pivots — giving you an always-current view of momentum structure. You’ll instantly see when RSI begins compressing or expanding, long before price reacts.
Key Features: • Dynamic RSI trendlines drawn from the last 2 pivots
• Auto re-draws in real-time as new pivots form
• Optional "Full Extend" or "Pivot Only" modes
• Slope color-coded: green = support, red = resistance
• Built-in dotted RSI levels (30/70 default)
• Alert conditions for RSI trendline breakout signals
• Ideal for spotting divergence, compression, and early SMC confluence
This is not your average RSI — it’s a fully reactive momentum edge overlay designed to give you clarity, structure, and timing from within the oscillator itself. Perfect for traders using Smart Money Concepts, divergence setups, or algorithmic trend tracking.
⚔️ Built for precision. Built for edge. Built for Apex.

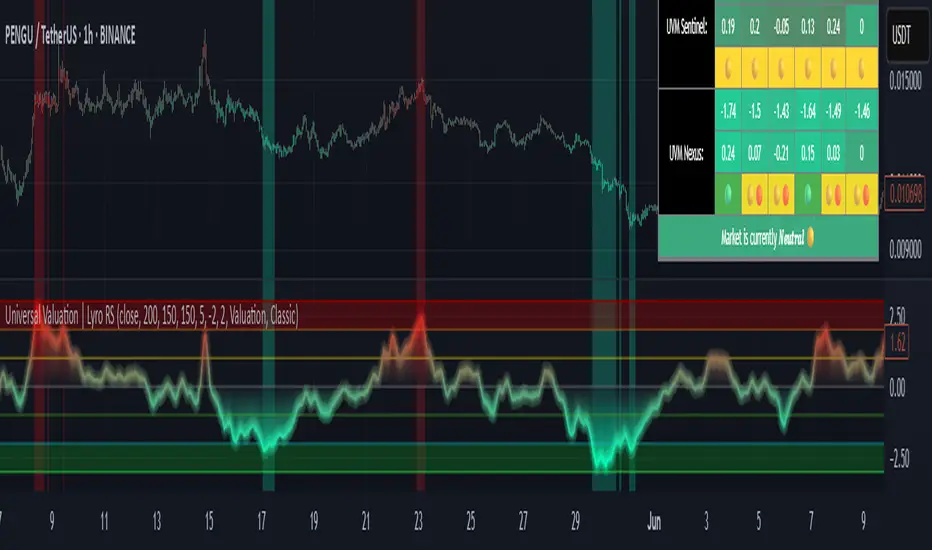
Universal Valuation | Lyro RSUniversal Valuation
⚠️Disclaimer: This indicator is a tool for technical analysis and does not provide guaranteed results. It should be used in conjunction with other analysis methods and proper risk management practices. The creators of this indicator are not responsible for any financial decisions made based on its signals.
Overview
The Universal Valuation indicator helps identify whether the market is undervalued/cheap or overvalued/expensive. And another mode this indicator offers is This cutting-edge tool works flawlessly ACROSS ALL TIMEFRAMES & TICKERS/CHARTS.
By combining regular TradingView indicators & some of our valuation indicators basic/simple with advanced statistical functions, this indicator offers a powerful, universal valuation tool.
Key Features
INPUTS: The Universal Valuation indicator offers flexibility through its customizable input sections. The "Indicator Settings" let you adjust lengths for the raw indicators and statistical functions. The "Signals" section defines thresholds for background color changes, helping you visually spot key market moments. The "Colors" section allows you to pick from pre-defined schemes or personalize colors for better clarity. Lastly, the "Tables" section gives you full control over the UV table’s size and positioning, including options to overlay it on the chart or place it in the allocated space.
A DEEPER INSIGHT: This indicator is built around three distinct categories: "UVM Andromeda," "UVM Sentinel," and "UVM Nexus." Each category has three different drivers. The statistical function powering this indicator is the Z-score. The Z-score is an incredibly powerful tool that helps determine if the market is overvalued/expensive or undervalued/cheap, offering critical insights for traders."
Plotting: The plotted value represents the average of all the drivers. In other words, it is the combined average of all 9 Z-scored indicators, providing a balanced and comprehensive market valuation.
What is Z-score? & Why does this system use it?
Z-score is an advanced statistical function used to measure how far a value deviates from the average in a data set. The formula for Z-score is: (x - h) / o, where x is the observed value, h is the average (mean) of the data set, and o is the standard deviation.
This system uses the Z-score because it helps determine whether the market is overvalued or undervalued based on historical data and how we apply the calculation. By measuring how far a value deviates from the average, the Z-score provides a clearer and more objective valuation of market conditions. In our case, a Z-score of -3 indicates an undervalued market, while a Z-score of 3 signals an overvalued market.
UVM Andromeda:
UVM stands for Universal Valuation Model, which is the core of this indicator. Andromeda, one of the most stunning galaxies in the universe, inspired by its name. We chose this name because a powerful indicator should not only be effective but also visually appealing.
You might be wondering what drives UVM Andromeda. The three key drivers are Price, RSI, and ROC. These indicators are pre-defined, while the "Indicator Settings" allow you to adjust the length of the Z-score calculation, refining how the model analyzes market conditions.
UVM Sentinel:
Sentinel, refers to a guard or watchman, someone or something that keeps watch and provides protection. In our case this name refers to a model that actively observes market conditions, acting as a vigilant tool that signals important shifts in valuation.
Wondering what drives UVM Sentinel? The three key drivers are BB%, CCI, and Crosby. While these indicators are simple on their own, applying our Z-score function elevates them to a whole new level, enhancing their ability to detect market conditions with greater accuracy.
UVM Nexus:
We chose the name Nexus simply because it sounds cool—there’s no deeper meaning behind it for us. However, the word itself does have a meaning; it refers to a connection or link between multiple things.
The three key drivers for UVM Nexus are the Sharpe, Sortino, and Omega ratios. These are all asset performance metrics, but by applying the Z-score, we transform them into powerful valuation indicators/drivers, giving you a deeper insight into market conditions.
Why do we use 9 different indicators instead of 1?
That's a great question, and the answer is quite simple. Think of it like this: if you have one super soldier, and they miss a shot, it’s game over. But if you have many soldiers, even if one misses, the others can step in and take the shot. The strength of using multiple indicators lies in their collective power – if one misses, the others still provide valuable insights, making the overall system more reliable.
Final Thoughts:
In our Universal Valuation indicator, you have the flexibility to customize it however you like using our inputs. The system is divided into three distinct categories, with each category containing three indicators. The value plotted on the chart is the average of all nine indicators. We apply the Z-score, an advanced statistical function, to each of these nine indicators. The final plotted average is the average of all the Z-scores, giving you a comprehensive and refined market valuation. This indicator can work on any timeframe & chart ticker.
Crypto Trend StrengthCrypto Trend Strength Dashboard (11-Point System)
Description:
This indicator is a visually enhanced dashboard that evaluates 11 key technical signals to assess bullish momentum for crypto. Each condition is displayed in a easy reading table for quick interpretation and visual appeal.
Signals include:
Higher highs and higher lows
Price above SMA18 and SMA365
SMA180 > SMA365
Positive slope on SMA180 and SMA365
RSI trending upward
Ideal for traders who want a clean, at-a-glance summary of market strength without scanning multiple charts or indicators.

Multi-Timeframe Trend TableDetects the trend on multi-timeframe using cross over of 20 and 50 Exponential Moving Average (EMA)

MTF FVGs [Fadi x MMT]The MTF FVGs indicator is a powerful tool for identifying and visualizing Fair Value Gaps (FVGs) across multiple timeframes on TradingView. It provides traders with customizable options to display bullish and bearish FVGs, control their appearance, and manage mitigated gaps, making it ideal for price action and imbalance-based trading strategies.
Features
Multi-Timeframe Support : Analyzes FVGs on up to seven timeframes, including an auto-adjusted timeframe and user-defined periods (e.g., 5m, 15m, 1H, 4H, 1D, 1W).
Customizable Display : Toggle visibility of FVG open, close, central equilibrium (C.E.), and connecting lines with adjustable styles (solid, dashed, dotted) and sizes.
Background Fill : Option to fill FVG areas with customizable transparency for better visualization.
Mitigation Settings : Show or hide mitigated FVGs with configurable mitigation criteria (e.g., touched, wick-filled, body-filled) and extend mitigated lines.
Labeling Options : Display labels for timeframes, FVG types (BISI/SIBI), and levels (open, close, C.E.) with customizable colors and sizes.
Proximity Filtering : Hide FVGs outside a specified price range based on daily or monthly ATR for cleaner charts.
Timeframe Filtering : Hide lower or current timeframe FVGs to focus on higher timeframe imbalances.
Performance Optimization : Limits the number of displayed FVGs and supports up to 5000 bars back, 500 lines, labels, and boxes.
Settings
Higher Timeframe (HTF) FVG Settings
Show/Hide : Enable or disable FVGs for each timeframe.
Timeframe Selection : Choose specific timeframes (e.g., 5m, 15m, 1H, 4H, 1D, 1W) or use auto-selection based on the current chart.
Colors : Set bullish (default: green) and bearish (default: red) FVG colors.
Max Count : Limit the number of FVGs displayed per timeframe (default: 5).
Display Settings
Open/Close Lines : Toggle visibility, style (solid, dashed, dotted), and size (1-4) for FVG boundaries.
Central Equilibrium (C.E.) : Show/hide the midpoint line with customizable style, size, and colors (default: white with transparency).
Link Line : Display a connecting line between FVG boundaries with adjustable style and size.
Background Transparency : Enable/disable fill between FVG boundaries with adjustable transparency (50%-98%).
Mitigation Settings
Show Mitigated FVGs : Toggle visibility of mitigated gaps.
Mitigation Type : Choose criteria for mitigation (None, Touched, Wick Filled, Body Filled, Wick Filled Half, Body Filled Half).
Mitigated Colors : Set colors for mitigated bullish and bearish FVGs (default: gray with transparency).
Extend Mitigated Lines : Extend mitigated FVG lines by a specified number of bars (default: 5).
Labeling Settings
Label Display : Toggle labels for FVGs with customizable color, background color, and size (tiny, small, normal, large, huge).
Label Levels : Show labels for open, close, or C.E. levels.
Label Content : Include timeframe, FVG type (BISI/SIBI), or level information in labels.
Advanced Settings
Proximity Filter : Hide FVGs outside a price range based on daily ATR (adjustable factor: 1-10).
Label Combine Factor : Control label visibility to avoid clutter (default: 1.0).
ATR Range : Set the number of candles for ATR calculation (default: 10).
Line Extension : Extend FVG lines by a set number of bars (default: 4) or based on price range conditions.
Timeframe Spacing : Adjust spacing between FVGs from different timeframes (default: 4 bars).
How to Use
Add the indicator to your TradingView chart.
Configure the desired timeframes and settings via the indicator's input menu.
Analyze FVGs to identify potential support/resistance zones or imbalance areas for trading decisions.
Use mitigation settings to track filled gaps and proximity filters to focus on relevant price levels.
تنبؤ حركة الشارت (حجم وخطوط اتجاه)this indicator for estimated movement on 15 or 5 mints try it and note the R & S lines .
good luke

AI Breakout Bands (Zeiierman)█ Overview
AI Breakout Bands (Zeiierman) is an adaptive trend and breakout detection system that combines Kalman filtering with advanced K-Nearest Neighbor (KNN) smoothing. The result is a smart, self-adjusting band structure that adapts to dynamic market behavior, identifying breakout conditions with precision and visual clarity.
At its core, this indicator estimates price behavior using a two-dimensional Kalman filter (position + velocity), then enhances the smoothing process with a nonlinear, similarity-based KNN filter. This unique blend enables it to handle noisy markets and directional shifts with both speed and stability — providing breakout traders and trend followers a reliable framework to act on.
Whether you're identifying volatility expansions, capturing trend continuations, or spotting early breakout conditions, AI Breakout Bands gives you a mathematically grounded, visually adaptive roadmap of real-time market structure.
█ How It Works
⚪ Kalman Filter Engine
The Kalman filter models price movement as a state system with two components:
Position (price)
Velocity (trend direction)
It recursively updates predictions using real-time price as a noisy observation, balancing responsiveness with smoothness.
Process Noise (Position) controls sensitivity to sudden moves.
Process Noise (Velocity) controls smoothing of directional flow.
Measurement Noise (R) defines how much the filter "trusts" live price data.
This component alone creates a responsive yet stable estimate of the market’s center of gravity.
⚪ Advanced K-Neighbor Smoothing
After the Kalman estimate is computed, the script applies a custom K-Nearest Neighbor (KNN) smoother.
Rather than averaging raw values, this method:
Finds K most similar past Kalman values
Weighs them by similarity (inverse of absolute distance)
Produces a smoother that emphasizes structural similarity
This nonlinear approach gives the indicator an AI feature — reacting fast when needed, yet staying calm in consolidation.
█ How to Use
⚪ Trend Recognition
The line color shifts dynamically based on slope direction and breakout confirmation.
Bullish conditions: price above the mid band with positive slope
Bearish conditions: price below the mid band with negative slope
⚪ Breakout Signals
Price breaking above or below the bands may signal momentum acceleration.
Combine with your own volume or momentum confirmation for stronger entries.
Bands adapt to market noise, helping filter out low-quality whipsaws.
█ Settings
Process Noise (Position): Controls Kalman filter’s sensitivity to price changes.
Process Noise (Velocity): Controls smoothing of directional component.
Measurement Noise (R): Defines how much trust is placed in price data.
K-Neighbor Length: Number of historical Kalman values considered for smoothing.
Slope Calculation Window: Number of bars used to compute trend slope of the smoothed Kalman.
Band Lookback (MAE): Rolling period for average absolute error.
Band Multiplier: Multiplies MAE to determine band width.
-----------------
Disclaimer
The content provided in my scripts, indicators, ideas, algorithms, and systems is for educational and informational purposes only. It does not constitute financial advice, investment recommendations, or a solicitation to buy or sell any financial instruments. I will not accept liability for any loss or damage, including without limitation any loss of profit, which may arise directly or indirectly from the use of or reliance on such information.
All investments involve risk, and the past performance of a security, industry, sector, market, financial product, trading strategy, backtest, or individual's trading does not guarantee future results or returns. Investors are fully responsible for any investment decisions they make. Such decisions should be based solely on an evaluation of their financial circumstances, investment objectives, risk tolerance, and liquidity needs.

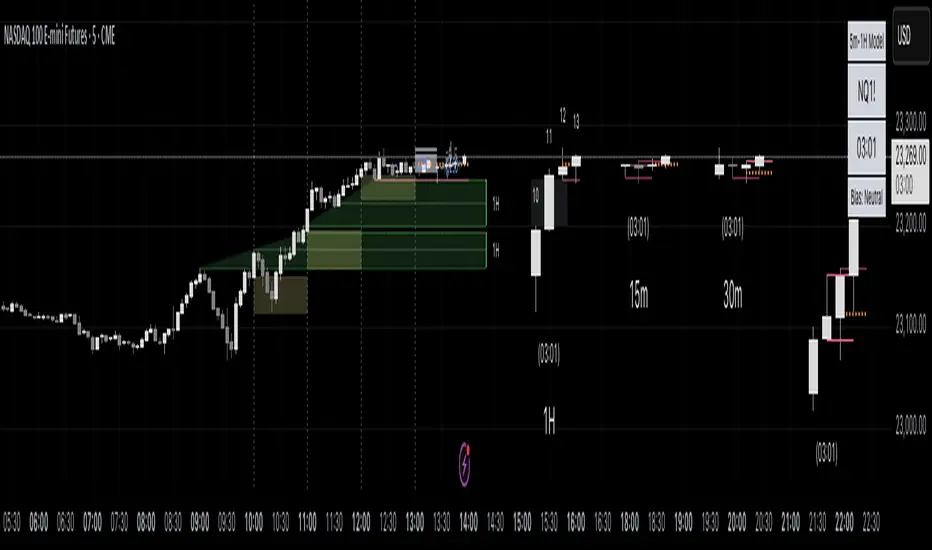
IB Breakout Strategy with Fib, CVD, and DivergenceEntry rules and signals- I wait for the 5min IB(initial balance) to form every session for eg-(first 5min candle of london session or ny session, marking top wick to bottom wick of first 5 min candle with a midpoint in that zone.Then look for CVD(cumulative volume delta) if it's alining with my analysis.I also mark previous session fib levels for scalp entries on .618 or .78 level.Also i do mark previous day VAH(value area high),VAL(value area low) and POC(point of control) for better understanding of direction.
Initial stop loss and take profit values-Initial stop loss varies from 200$ to 500$ and take profit varies from 250$ to 500$.
Number of contracts you plan to trade based on system stats and risk management-I plan to trade 1-2 contracts until i reach the safety net.Once safety net is achieved based on my entry level i decide the contract size which varies from 1-4 contracts.
Trade management and any trailing stop methods-I trail the stop once i feel like there's enough room for the trade.I manage the trade on the basis of strength of a candle, if its taking much time without strength i exit the trade.

HTF/LTF Boxes v2.2HTF/LTF boxes with GANN levels
added second LTF
Script is identifying hourly boxes and breakouts in respective quarters.
Two lower time frames are available, also gann levels of previous hour's range is available.

PCR tableOverview
This indicator displays a multi-period table of forward-looking price projections. It combines normalized directional momentum (Positive Change Ratio, PCR) with volatility (ATR) and presents a forecast for upcoming time intervals, adjusted for your local UTC offset.
Concepts & Calculations
Positive Change Ratio (PCR):
((total positive change)/(total change)-0.5)*2, producing a value between –100 and +100.
Synthetic ATR: Calculates average true range over the same lookbacks to capture volatility.
PCR × ATR: Forms a volatility-weighted directional forecast, indicating expected move magnitude.
Future Price Projection: Adds PCR × ATR value to current close to estimate future price at each lookahead interval.
Table Layout
There are 12 forecast horizons—1× to 12× the chart timeframe (e.g., minutes, hours, days). Each row displays:
1. Future Time: Timestamp of each projection (adjustable via UTC offset)
2. PCR: Directional bias per period (–1 to +1)
3. PCR × ATR: E xpected move magnitude
4. Future Price: Close + (PCR × ATR)
High and low PCR×ATR rows are highlighted green for minimum value in the price forecast (buy signal) or red for maximum value in the price forecast (sell signal).
How to Use
1. Set UTC offset to your time zone for accurate future timestamps.
2. View PCR to assess bullish (positive) or bearish (negative) momentum.
3. Use PCR × ATR to estimate move strength and direction.
4. Reference Future Price for potential levels over upcoming intervals, and for buy and sell signals.
Limitations & Disclaimers
* This model uses linear extrapolation based on recent price behavior. It does not guarantee future prices.
* It uses only current bar data and no lookahead logic—compliant with Pine Script rules.
* Designed for analytical insight, not as an automated signal or trade executor.
* Best used on standard bar/candle charts (avoid non-standard types like Heikin‑Ashi or Renko).

Support/Resistance LevelsThis indicator automatically detects the most relevant support and resistance levels based on recent pivot points.
Main Features:
✅ Automatic detection of support and resistance zones
✅ Fully customizable: line style, thickness, and colors
✅ Optional support/resistance zones (based on percentage)
✅ High/Low zone fill for recent extremes
✅ Auto-labeling of S/R levels on the chart
✅ Configurable line extension (right side only or both sides)
⚙️ Custom Settings:
Toggle S/R levels on or off
Choose line style (solid, dotted, dashed)
Set support/resistance colors
Adjust line width
Enable/disable zone display
Set zone width as a percentage
🔎 Use Cases:
Quickly identify key price levels
Trade with confidence around bounces and breakouts
Works on any market and any timeframe

CandleTrack Pro | Pure Price Action Trend Detection CandleTrack Pro | Pure Price Action Trend Detection with Smart Candle Coloring
📝 Description:
CandleTrack Pro is a clean, lightweight trend-detection tool that uses only candle structure and ATR-based logic to determine market direction — no indicators, no overlays, just pure price action.
🔍 Features:
✅ Smart Candle-Based Trend Detection
Uses dynamic ATR thresholds to identify trend shifts with precision.
✅ Doji Protection Logic
Automatically filters indecision candles to avoid whipsaws and false signals.
✅ Dynamic Bull/Bear Color Coding
Bullish candles are colored green, bearish candles are colored red — see the trend instantly.
✅ No Noise, No Lag
No moving averages, no smoothing — just real-time decision-making power based on price itself.
📈 Ideal For:
Price action purists
Scalpers and intraday traders
Swing traders looking for clear visual bias
─────────────────────────────────────────────────────────────
Disclaimer:
This indicator is provided for educational and informational purposes only and should not be considered as financial or investment advice. The tool is designed to assist with technical analysis, but it does not guarantee any specific results or outcomes. All trading and investment decisions are made at your own risk. Past performance is not indicative of future results. Always do your own research and consult with a qualified financial advisor before making any trading decisions. The author accepts no liability for any losses or damages resulting from the use of this script. By using this indicator, you acknowledge and accept these terms.
─────────────────────────────────────────────────────────────
