OPEN-SOURCE SCRIPT
Trend Zone Breakouts
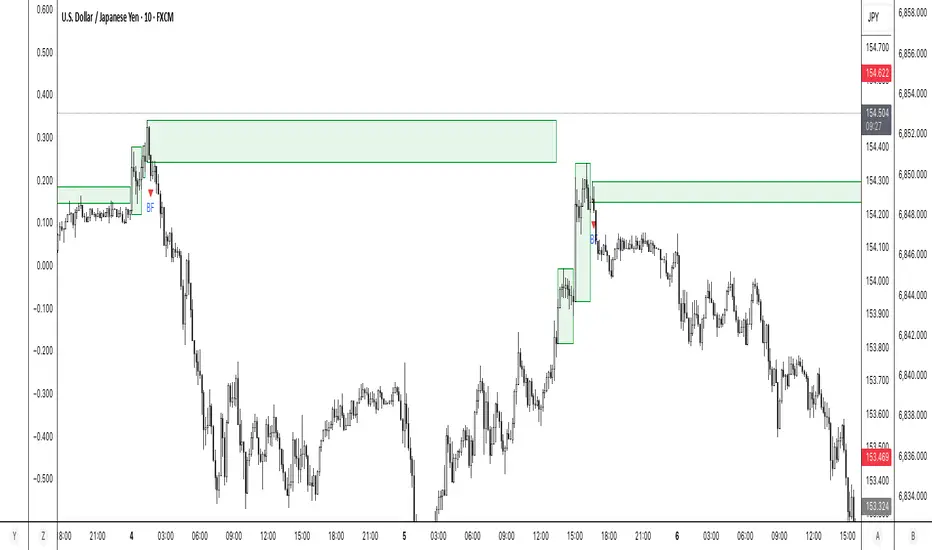
The HD Trend Zone Breakouts indicator identifies when the market is trending strongly on both your chart timeframe and a higher timeframe, then tracks moments where price becomes stretched inside that trend. When this stretch occurs, the indicator builds a dynamic zone capturing the full high–low range during that extension. Once the stretch ends, the zone is frozen, and the script waits to see how price reacts to it. Breakouts above or below these zones signal whether the trend is likely to continue or fail. This creates a powerful structure-based way to time entries, exits, and reversals without relying on noisy overbought/oversold signals.
How It Works
Confirms trend direction on both lower and higher timeframes using an EMA-based regime.
Detects stretched conditions using RSI only when both timeframes are aligned.
Draws a price zone around candles formed during these extreme trend pushes.
Freezes the zone once the stretch ends, creating a reference area.
Monitors for breakouts above/below the zone to confirm trend continuation or trend failure.
Breakout Logic
Bull continuation → price breaks above the top of a bullish zone.
Bull failure → price breaks below the bottom of a bullish zone.
Bear continuation → price breaks below the bottom of a bearish zone.
Bear failure → price breaks above the top of a bearish zone.
Why It’s Useful
Distinguishes meaningful extensions from ordinary RSI signals.
Provides clear structural levels for timing trades.
Identifies trend continuation early and flags potential reversals.
Works extremely well alongside EMAC Forecast, Trend Exhaustion Lite, and Volatility Squeeze.
Açık kaynak kodlu komut dosyası
Gerçek TradingView ruhuyla, bu komut dosyasının yaratıcısı, yatırımcıların işlevselliğini inceleyip doğrulayabilmesi için onu açık kaynaklı hale getirdi. Yazarı tebrik ederiz! Ücretsiz olarak kullanabilseniz de, kodu yeniden yayınlamanın Topluluk Kurallarımıza tabi olduğunu unutmayın.
hdalgos.com for Trade Analysis and Indicators
Developed by former Goldman Sachs Trader
Developed by former Goldman Sachs Trader
Feragatname
Bilgiler ve yayınlar, TradingView tarafından sağlanan veya onaylanan finansal, yatırım, alım satım veya diğer türden tavsiye veya öneriler anlamına gelmez ve teşkil etmez. Kullanım Koşulları bölümünde daha fazlasını okuyun.