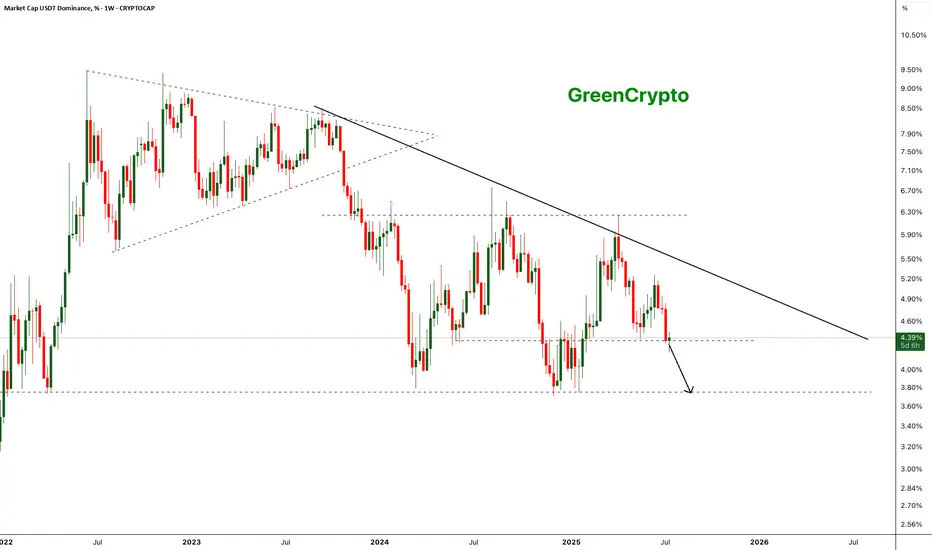
The chart shows a clear long-term descending trendline acting as resistance since mid-2023. After multiple failed attempts to break this trendline, USDT dominance has broken below a key horizontal support around ~4.35% on strong bearish momentum.
- Weekly close below the ~4.35% horizontal support.
Next key support zone: ~3.65–3.70% (marked by previous 2023 lows).
- Strong bearish engulfing candle confirming breakdown.
- Bearish continuation expected if dominance remains below 4.35%.
Further drop of the usdt dominance will start the altseason
Cheers
GreenCrypto
📢 Telegram Channel: t.me/getgreencrypto
🆓 Free Trial / Contact Us: t.me/greencryptosupport
🌐 Website: greencrypto.net
📚 Docs: docs.greencrypto.net
🆓 Free Trial / Contact Us: t.me/greencryptosupport
🌐 Website: greencrypto.net
📚 Docs: docs.greencrypto.net
İlgili yayınlar
Feragatname
Bilgiler ve yayınlar, TradingView tarafından sağlanan veya onaylanan finansal, yatırım, işlem veya diğer türden tavsiye veya tavsiyeler anlamına gelmez ve teşkil etmez. Kullanım Şartları'nda daha fazlasını okuyun.