SPY pulled back after printing a fresh weekly BOS, and now it’s sitting right on top of a major trendline that has supported every rally since early summer. This week is all about whether SPY stabilizes or whether momentum cools enough to trigger a deeper corrective move.
Here’s the full structured breakdown.
1. Weekly Timeframe (1W)
Macro Structure
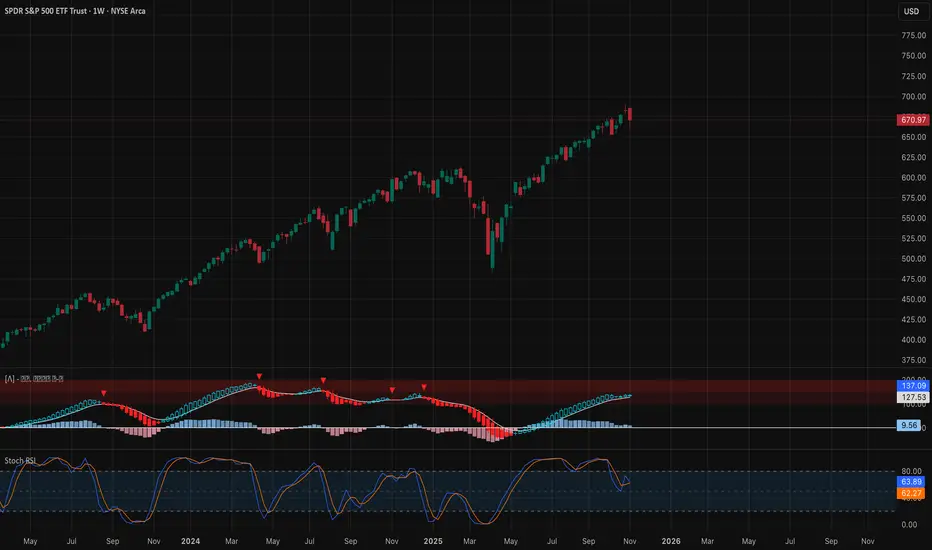
SPY has been in a strong weekly uptrend since the March bottom, printing BOS after BOS with clean demand re-accumulation zones. Last week gave us the first meaningful pullback after tagging the upper boundary of the rising macro channel.
The weekly trendline from April is still intact, and SPY is currently sitting right above it. As long as this trendline holds, bulls keep control.
Weekly MACD remains bullish but is curling for a momentum slowdown. Stoch RSI is turning down from overbought territory — not a bearish reversal yet, but a signal that SPY is cooling off after a multi-month climb.
Weekly Key Zones Support: 652–660 Next major support: 612–620 Resistance above: 700+ (upper channel)
Weekly Take This is a cooling phase inside a bullish macro trend. The weekly trend only flips if SPY breaks under 652 and closes below it.
2. Daily Timeframe (1D)

Trend and Structure
SPY printed a clear daily CHoCH, followed by a shift back into the prior range. The break of structure at the highs confirms sellers stepped in after several failed attempts to push into 690+.
The key zone right now is 660–670, where trendline support and a large daily demand zone overlap.
Daily MACD flipped red and expanded lower. Stoch RSI is in oversold territory — SPY has room to bounce, but there's no confirmed reversal yet.
Daily Levels Hold above 670 → upside back into 678, then 685. Break below 670 → opens 662, then 652.
Daily View SPY is sitting on important support, and buyers must defend 670 early this week to avoid a sharper drop.
3. 1-Hour Timeframe (1H)

Short-Term Structure
SPY has been moving inside a clean descending channel for days. Multiple BOS events confirmed the downtrend, but we finally got a bullish CHoCH near 662 — the first real sign of buyers stepping in.
Now price is pushing toward the top of the channel around 672–673. This is the short-term pivot.
1H MACD is curling up with strong momentum. Stoch RSI supports continuation into resistance.
1H Trade Levels Reject 672–673 → pullback toward 668 then 662. Break above 673 → opens 678 and possibly 680.
This level will set the tone for Monday’s open.
4. 15-Minute Timeframe (15M)

Intraday Structure
The 15M broke the downtrend first, with a tight BOS + CHoCH combo. Follow-through is clean, and price is now forming a higher-low sequence while holding above intraday demand.
The intraday ceiling remains 672–673, matching the 1H trendline.
MACD on 15M is strong, with rising histogram bars. Stoch RSI is elevated but still has breathing room.
15M Trade Levels Above 673 → scalp long into 676, then 678–680. Reject at 673 → scalp short back to 668, then 665.
SPY will likely decide its direction for the entire session at this level.
5. GEX Map & Options Analysis

GEX Highlights
Positive GEX (call resistance): 678 → 682 → 685 Negative GEX (put support): 666 → 661 → 658
Large call walls above 680–685 will slow upside. Large put walls below 666–661 will attract price if SPY fails at 673.
What That Means This Week
– Upside becomes heavy near 680–685 – Losing 670 shifts gravity to 666 and 661 – As long as SPY holds above 670, market stays controlled – Below 666 → volatility and put pressure expand fast
Options Setups
If SPY rejects 673: → Short-term PUTs aiming for 668 → 666
If SPY breaks 673 and holds: → Short-term CALLs targeting 676 → 680
Avoid chasing moves into 685 — heavy GEX resistance.
My Thought
SPY is sitting at a crucial support trendline, and the reaction at 672–673 will decide how the entire week unfolds. A clean break above that zone unlocks room back into 678 and 680. A rejection brings SPY back into 668, and if that breaks, then 662–661 quickly come into play.
This is a level-driven week. Let 673 decide your bias — don’t guess it.
Disclaimer
This analysis is for educational purposes only and not financial advice. Always manage your risk and follow your plan.
Here’s the full structured breakdown.
1. Weekly Timeframe (1W)
Macro Structure
SPY has been in a strong weekly uptrend since the March bottom, printing BOS after BOS with clean demand re-accumulation zones. Last week gave us the first meaningful pullback after tagging the upper boundary of the rising macro channel.
The weekly trendline from April is still intact, and SPY is currently sitting right above it. As long as this trendline holds, bulls keep control.
Weekly MACD remains bullish but is curling for a momentum slowdown. Stoch RSI is turning down from overbought territory — not a bearish reversal yet, but a signal that SPY is cooling off after a multi-month climb.
Weekly Key Zones Support: 652–660 Next major support: 612–620 Resistance above: 700+ (upper channel)
Weekly Take This is a cooling phase inside a bullish macro trend. The weekly trend only flips if SPY breaks under 652 and closes below it.
2. Daily Timeframe (1D)
Trend and Structure
SPY printed a clear daily CHoCH, followed by a shift back into the prior range. The break of structure at the highs confirms sellers stepped in after several failed attempts to push into 690+.
The key zone right now is 660–670, where trendline support and a large daily demand zone overlap.
Daily MACD flipped red and expanded lower. Stoch RSI is in oversold territory — SPY has room to bounce, but there's no confirmed reversal yet.
Daily Levels Hold above 670 → upside back into 678, then 685. Break below 670 → opens 662, then 652.
Daily View SPY is sitting on important support, and buyers must defend 670 early this week to avoid a sharper drop.
3. 1-Hour Timeframe (1H)
Short-Term Structure
SPY has been moving inside a clean descending channel for days. Multiple BOS events confirmed the downtrend, but we finally got a bullish CHoCH near 662 — the first real sign of buyers stepping in.
Now price is pushing toward the top of the channel around 672–673. This is the short-term pivot.
1H MACD is curling up with strong momentum. Stoch RSI supports continuation into resistance.
1H Trade Levels Reject 672–673 → pullback toward 668 then 662. Break above 673 → opens 678 and possibly 680.
This level will set the tone for Monday’s open.
4. 15-Minute Timeframe (15M)
Intraday Structure
The 15M broke the downtrend first, with a tight BOS + CHoCH combo. Follow-through is clean, and price is now forming a higher-low sequence while holding above intraday demand.
The intraday ceiling remains 672–673, matching the 1H trendline.
MACD on 15M is strong, with rising histogram bars. Stoch RSI is elevated but still has breathing room.
15M Trade Levels Above 673 → scalp long into 676, then 678–680. Reject at 673 → scalp short back to 668, then 665.
SPY will likely decide its direction for the entire session at this level.
5. GEX Map & Options Analysis
GEX Highlights
Positive GEX (call resistance): 678 → 682 → 685 Negative GEX (put support): 666 → 661 → 658
Large call walls above 680–685 will slow upside. Large put walls below 666–661 will attract price if SPY fails at 673.
What That Means This Week
– Upside becomes heavy near 680–685 – Losing 670 shifts gravity to 666 and 661 – As long as SPY holds above 670, market stays controlled – Below 666 → volatility and put pressure expand fast
Options Setups
If SPY rejects 673: → Short-term PUTs aiming for 668 → 666
If SPY breaks 673 and holds: → Short-term CALLs targeting 676 → 680
Avoid chasing moves into 685 — heavy GEX resistance.
My Thought
SPY is sitting at a crucial support trendline, and the reaction at 672–673 will decide how the entire week unfolds. A clean break above that zone unlocks room back into 678 and 680. A rejection brings SPY back into 668, and if that breaks, then 662–661 quickly come into play.
This is a level-driven week. Let 673 decide your bias — don’t guess it.
Disclaimer
This analysis is for educational purposes only and not financial advice. Always manage your risk and follow your plan.
Feragatname
The information and publications are not meant to be, and do not constitute, financial, investment, trading, or other types of advice or recommendations supplied or endorsed by TradingView. Read more in the Terms of Use.
Feragatname
The information and publications are not meant to be, and do not constitute, financial, investment, trading, or other types of advice or recommendations supplied or endorsed by TradingView. Read more in the Terms of Use.