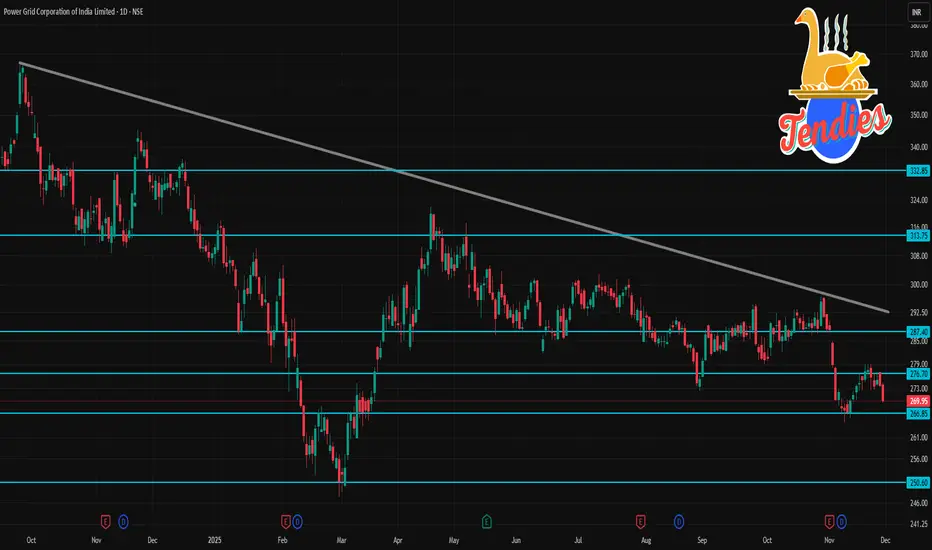
📊 POWERGRID — Current snapshot (daily timeframe)
As of last close, POWERGRID was trading around ₹ 269.95.
The 52-week trading range is roughly ₹ 247.30 (low) to ₹ 336.25 (high).
Over the past week, the share price is down about 2.76%, and over the last 6 months, down about 7.3%.
📈 Technical Indicators (Daily Chart)
According to a technical-analysis summary, moving averages and oscillators on daily timeframe show a “Strong Sell” signal for POWERGRID.
The 14-day RSI is near 31, which is close to oversold territory — indicating potential weakness or risk of a further drop.
Some charting platforms show mixed signals (some “sell”, some “neutral”), but overall bias remains bearish to weak, not bullish.
İlgili yayınlar
Feragatname
Bilgiler ve yayınlar, TradingView tarafından sağlanan veya onaylanan finansal, yatırım, alım satım veya diğer türden tavsiye veya öneriler anlamına gelmez ve teşkil etmez. Kullanım Koşulları bölümünde daha fazlasını okuyun.
İlgili yayınlar
Feragatname
Bilgiler ve yayınlar, TradingView tarafından sağlanan veya onaylanan finansal, yatırım, alım satım veya diğer türden tavsiye veya öneriler anlamına gelmez ve teşkil etmez. Kullanım Koşulları bölümünde daha fazlasını okuyun.