As of June 6, 2025, HDFC Bank Ltd. (NSE: HDFCBANK) is trading at approximately ₹1,944.90. Here's a detailed technical analysis focusing on daily support and resistance levels:
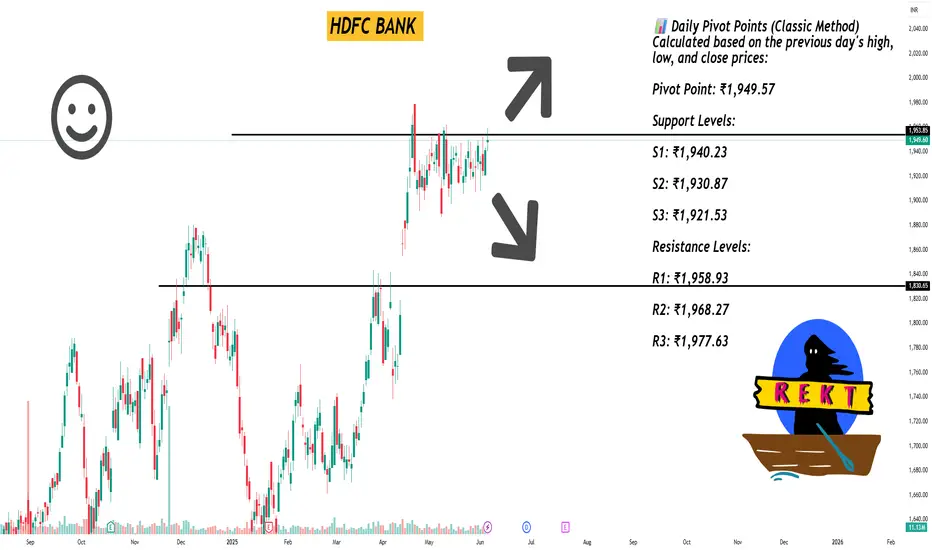
📊 Daily Pivot Points (Classic Method)
Calculated based on the previous day's high, low, and close prices:
Pivot Point: ₹1,949.57
Support Levels:
S1: ₹1,940.23
S2: ₹1,930.87
S3: ₹1,921.53
Resistance Levels:
R1: ₹1,958.93
R2: ₹1,968.27
R3: ₹1,977.63
Source: Top Stock Research
📈 Fibonacci Support & Resistance Levels
Based on Fibonacci calculations:
Support Levels:
S1: ₹1,942.42
S2: ₹1,938.01
S3: ₹1,930.87
Resistance Levels:
R1: ₹1,956.71
R2: ₹1,961.12
R3: ₹1,968.27
🔍 Camarilla Pivot Points
These levels are derived using the Camarilla method:
Support Levels:
S1: ₹1,947.89
S2: ₹1,946.17
S3: ₹1,944.46
Resistance Levels:
R1: ₹1,951.31
R2: ₹1,953.03
R3: ₹1,954.74
📌 Trading Insights
Immediate Support: ₹1,940.23 (Classic S1)
Immediate Resistance: ₹1,958.93 (Classic R1)
Traders may consider these levels for setting stop-loss and take-profit orders. A break above ₹1,958.93 could signal bullish momentum, while a drop below ₹1,940.23 might indicate bearish pressure.
Hello Guys ..
WhatsApp link- wa.link/d997q0
Email - techncialexpress@gmail.com ...
Script Coder/Trader//Investor from India. Drop a comment or DM if you have any questions! Let’s grow together!
WhatsApp link- wa.link/d997q0
Email - techncialexpress@gmail.com ...
Script Coder/Trader//Investor from India. Drop a comment or DM if you have any questions! Let’s grow together!
İlgili yayınlar
Feragatname
Bilgiler ve yayınlar, TradingView tarafından sağlanan veya onaylanan finansal, yatırım, işlem veya diğer türden tavsiye veya tavsiyeler anlamına gelmez ve teşkil etmez. Kullanım Şartları'nda daha fazlasını okuyun.