Following its Q3 report with EPS of $12.25 (above expectations) and ~20% revenue growth,  GS shares held firm and began to recover.
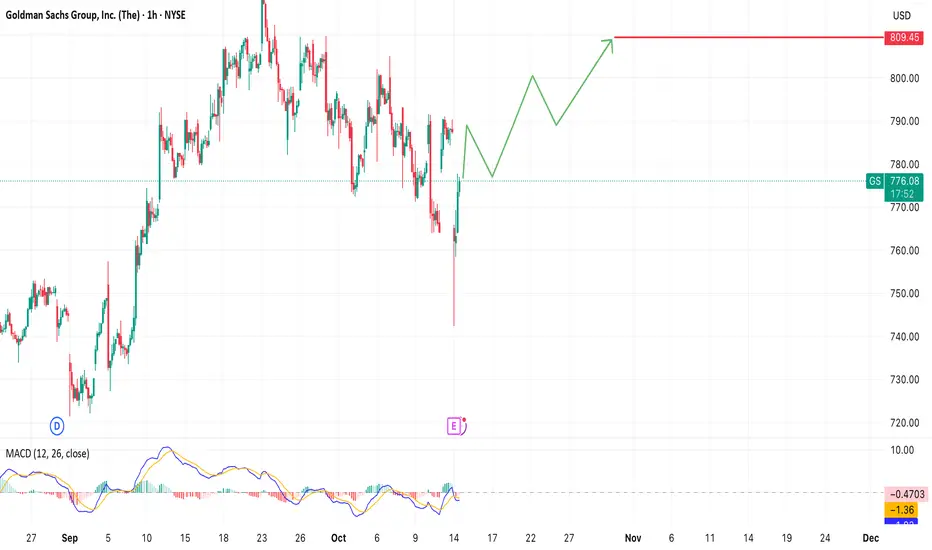
Key levels:
Support: $760 – 765
Resistance / Target: $809 — previous profit-taking zone
MACD is showing signs of a bullish reversal
Price structure suggests a potential short-term upward zigzag pattern
A breakout above $780 could confirm momentum toward the $809 target.
Fundamentally, GS remains one of the strongest names in the banking sector, with M&A and investment banking activity gaining traction again.
Feragatname
Bilgiler ve yayınlar, TradingView tarafından sağlanan veya onaylanan finansal, yatırım, alım satım veya diğer türden tavsiye veya öneriler anlamına gelmez ve teşkil etmez. Kullanım Koşulları bölümünde daha fazlasını okuyun.
Feragatname
Bilgiler ve yayınlar, TradingView tarafından sağlanan veya onaylanan finansal, yatırım, alım satım veya diğer türden tavsiye veya öneriler anlamına gelmez ve teşkil etmez. Kullanım Koşulları bölümünde daha fazlasını okuyun.