Güncellendi
FSR breaks out of Descending Triangle LONG
$NYSE:FSR
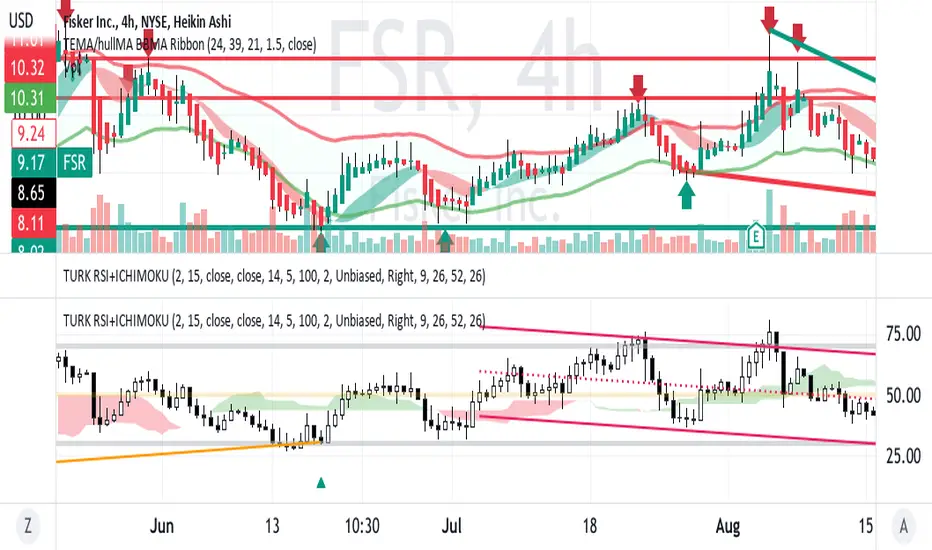
On the 4H chart with trendlines drawn FSR is trending up out of the triangle.
The RSI with Ichimoku indicator shows the confirmatory increasing relative strength
in a move from under to over the cloud.
All in all, this appears to be a swing long set up with a near upside of 20 %
or about $12 .
On the 4H chart with trendlines drawn FSR is trending up out of the triangle.
The RSI with Ichimoku indicator shows the confirmatory increasing relative strength
in a move from under to over the cloud.
All in all, this appears to be a swing long set up with a near upside of 20 %
or about $12 .
İşlem aktif
FSR had a nice 3% jump with a bullish candle after a doji showing buyers are taking trades.Feragatname
Bilgiler ve yayınlar, TradingView tarafından sağlanan veya onaylanan finansal, yatırım, alım satım veya diğer türden tavsiye veya öneriler anlamına gelmez ve teşkil etmez. Kullanım Koşulları bölümünde daha fazlasını okuyun.
Feragatname
Bilgiler ve yayınlar, TradingView tarafından sağlanan veya onaylanan finansal, yatırım, alım satım veya diğer türden tavsiye veya öneriler anlamına gelmez ve teşkil etmez. Kullanım Koşulları bölümünde daha fazlasını okuyun.