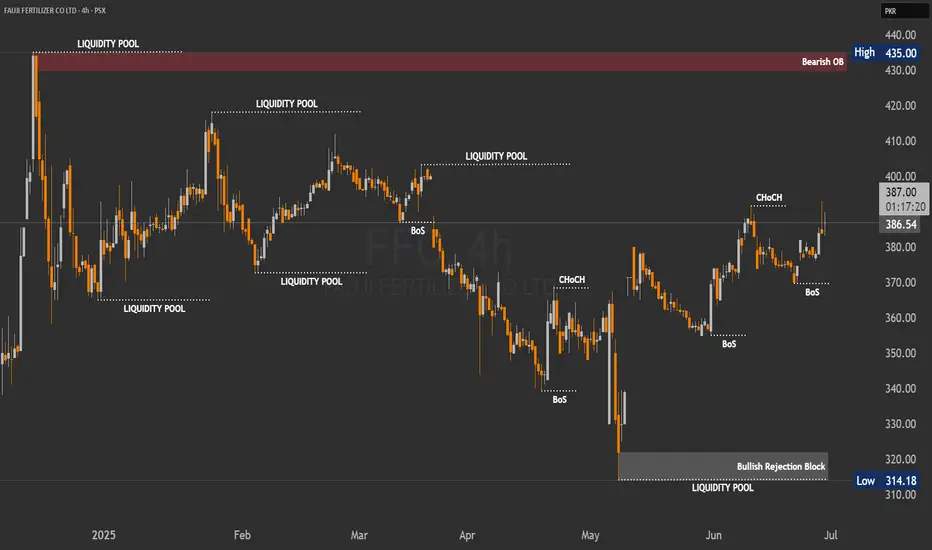
By analyzing the FFC chart on the 4-hour timeframe, we can see that price initially followed our bullish scenario, climbing 23 rupees up to 393. However, after hitting that level, price reversed and currently trading around 389 and eventually finding support around 376.
This area acted as a strong demand zone. Currently, FFC is trading around 389, and as long as price holds above the marked demand zone, we may expect another bullish move towards 390 and 400.
This area acted as a strong demand zone. Currently, FFC is trading around 389, and as long as price holds above the marked demand zone, we may expect another bullish move towards 390 and 400.
İşlem aktif
FFC now up to 390.00İşlem kapandı: hedefe ulaştı
FFC 404 🚀🚀Feragatname
Bilgiler ve yayınlar, TradingView tarafından sağlanan veya onaylanan finansal, yatırım, işlem veya diğer türden tavsiye veya tavsiyeler anlamına gelmez ve teşkil etmez. Kullanım Şartları'nda daha fazlasını okuyun.
Feragatname
Bilgiler ve yayınlar, TradingView tarafından sağlanan veya onaylanan finansal, yatırım, işlem veya diğer türden tavsiye veya tavsiyeler anlamına gelmez ve teşkil etmez. Kullanım Şartları'nda daha fazlasını okuyun.