Hi Traders
EUR/USD Multi-Timeframe analysis (15/03/2021)
H1 Chart (BUllish)
Target 1 at 1.19424 has been reached. We closed 50% of our position and have moved the stop loss at the lock-in-profits level at 1.18966 . Provided the market conditions will remain the same Target 2 will be reached soon.
Support & Resistance
1.18865 1.19148
1.18681 1.19455
1.18559 1.19891
H4 Chart (Bearish)
A high probability, entry signal to go SHORT was given at 1.19405 after the market found resistance at 1.19690 . Only the upward break of 1.19690 would cancel the bearish scenario.
Support & Resistance
1.18348 1.19910
1.17563 1.21121
1.16232 1.21738
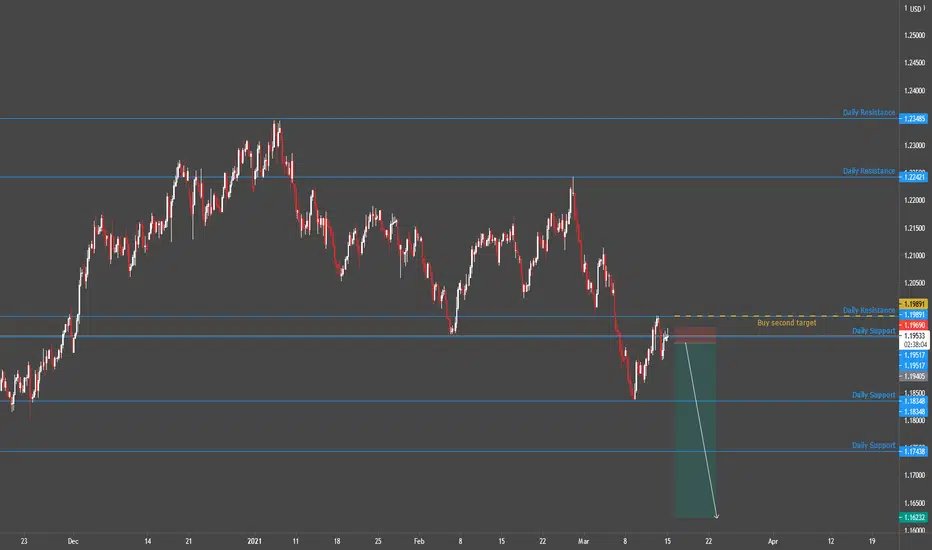
Daily Chart (Strong Down)
The market is approaching the resistance at 1.19891 . We are waiting to see reversal signals in order to reinstate SHORT positions. Next important resistance is the 1.22421 level.
Support & Resistance
1.19517 1.19891
1.18348 1.22421
1.17438 1.23485
Weekly Chart (Strong Up)
The market is dominated by uncertainty. The occasionally prevailing trend lasts for a limited time and changes its direction too frequently. As long as the market remains unstable, we stay aside, waiting for the market to get back on track.
Support & Resistance
N/A N/A
EUR/USD Multi-Timeframe analysis (15/03/2021)
H1 Chart (BUllish)
Target 1 at 1.19424 has been reached. We closed 50% of our position and have moved the stop loss at the lock-in-profits level at 1.18966 . Provided the market conditions will remain the same Target 2 will be reached soon.
Support & Resistance
1.18865 1.19148
1.18681 1.19455
1.18559 1.19891
H4 Chart (Bearish)
A high probability, entry signal to go SHORT was given at 1.19405 after the market found resistance at 1.19690 . Only the upward break of 1.19690 would cancel the bearish scenario.
Support & Resistance
1.18348 1.19910
1.17563 1.21121
1.16232 1.21738
Daily Chart (Strong Down)
The market is approaching the resistance at 1.19891 . We are waiting to see reversal signals in order to reinstate SHORT positions. Next important resistance is the 1.22421 level.
Support & Resistance
1.19517 1.19891
1.18348 1.22421
1.17438 1.23485
Weekly Chart (Strong Up)
The market is dominated by uncertainty. The occasionally prevailing trend lasts for a limited time and changes its direction too frequently. As long as the market remains unstable, we stay aside, waiting for the market to get back on track.
Support & Resistance
N/A N/A
Get my tool FREE HERE:
bit.ly/2ODALGH
FREE TELEGRAM GROUP:
bit.ly/3rYHjyd
GET MY FREE EDUCATION HERE:
bit.ly/3pQudRX
bit.ly/2ODALGH
FREE TELEGRAM GROUP:
bit.ly/3rYHjyd
GET MY FREE EDUCATION HERE:
bit.ly/3pQudRX
İlgili yayınlar
Feragatname
Bilgiler ve yayınlar, TradingView tarafından sağlanan veya onaylanan finansal, yatırım, işlem veya diğer türden tavsiye veya tavsiyeler anlamına gelmez ve teşkil etmez. Kullanım Şartları'nda daha fazlasını okuyun.