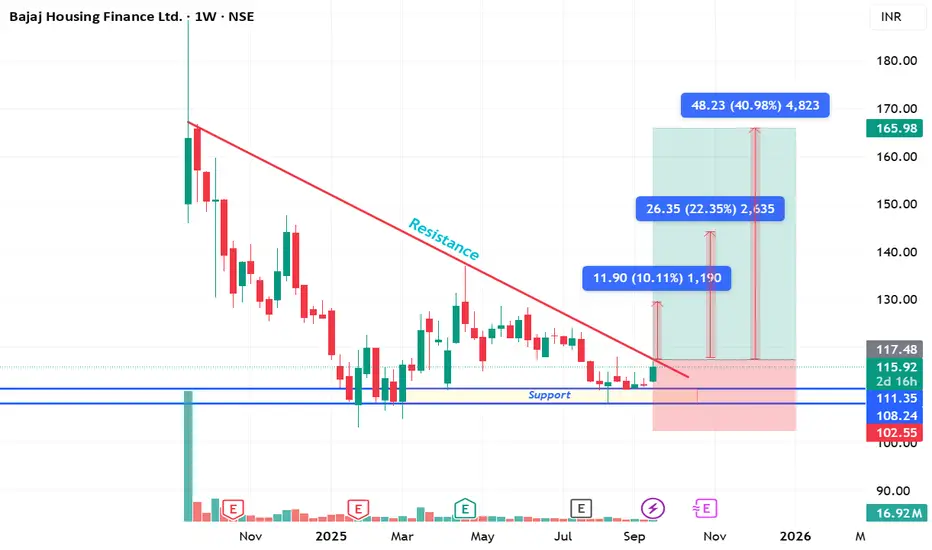
The stock is showing strong price action near the support zone of ₹111–₹108, with multiple rejections confirming demand.
🔹 Key Observations:
Price respecting the support zone (₹111–₹108).
Strong downtrend resistance line tested multiple times.
Breakout above resistance could trigger upside momentum.
🔹 Upside Targets:
🎯 Target 1: ₹127 (≈10% gain)
🎯 Target 2: ₹142 (≈22% gain)
🎯 Target 3: ₹166 (≈41% gain)
🔹 Risk Management:
Stop Loss: ₹102 (below support zone).
Risk-to-Reward looks favorable for positional traders.
⚠️ Note: This is purely for educational purposes, not financial advice. Always do your own research before investing.
#BajajHousingFinance #NSEStocks #SwingTrading #Breakout #TechnicalAnalysis #SupportResistance #IndianStockMarket #TradingView
Feragatname
Bilgiler ve yayınlar, TradingView tarafından sağlanan veya onaylanan finansal, yatırım, alım satım veya diğer türden tavsiye veya öneriler anlamına gelmez ve teşkil etmez. Kullanım Koşulları bölümünde daha fazlasını okuyun.
Feragatname
Bilgiler ve yayınlar, TradingView tarafından sağlanan veya onaylanan finansal, yatırım, alım satım veya diğer türden tavsiye veya öneriler anlamına gelmez ve teşkil etmez. Kullanım Koşulları bölümünde daha fazlasını okuyun.