📊 Latest snapshot
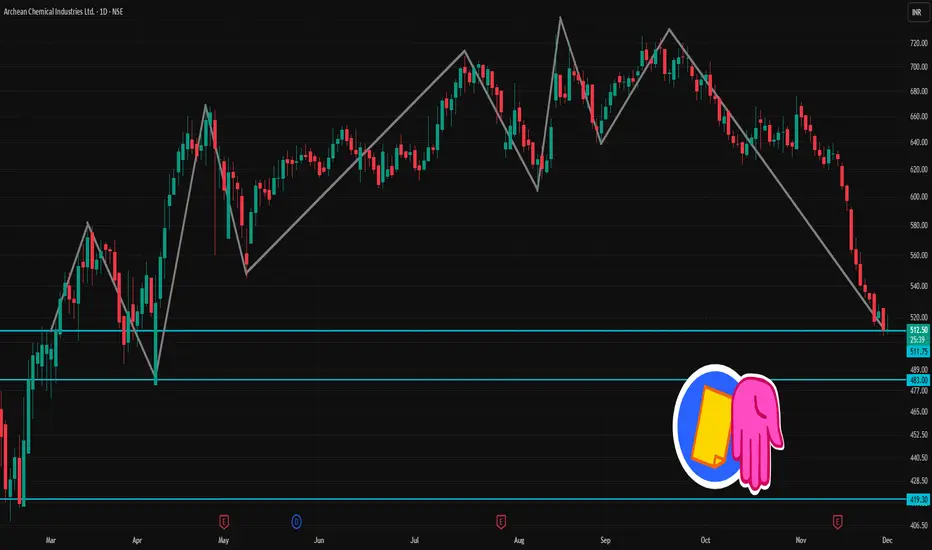
Recent price ~ ₹ 512 – ₹ 513
52-week range: ~ ₹ 408 (low) to ~ ₹ 730 (high)
Recent technical-analysis summary: Mixed/Neutral to bearish — some moving averages give bullish bias but oscillators appear weak.
⚠️ Technical Signals (Short-Term)
According to one technical summary, short-term trend is marked as “sell”.
Oscillators (e.g. RSI/Stochastic) recently suggest weak or bearish momentum.
✅ What to Watch / Trading Cautions
Momentum is weak; oscillators don’t suggest a strong bullish bounce yet.
If price drops below support (~₹ 508), downside risk increases; need close stop-loss discipline.
Volume & broader market/sector conditions could swing price sharply — stay alert for volatility.
On a bounce, watch if resistance zones get challenged — a breakout may change short-term trend.
İlgili yayınlar
Feragatname
Bilgiler ve yayınlar, TradingView tarafından sağlanan veya onaylanan finansal, yatırım, alım satım veya diğer türden tavsiye veya öneriler anlamına gelmez ve teşkil etmez. Kullanım Koşulları bölümünde daha fazlasını okuyun.
İlgili yayınlar
Feragatname
Bilgiler ve yayınlar, TradingView tarafından sağlanan veya onaylanan finansal, yatırım, alım satım veya diğer türden tavsiye veya öneriler anlamına gelmez ve teşkil etmez. Kullanım Koşulları bölümünde daha fazlasını okuyun.